Want to ride gold higher? Here’s when to buy
In the last few weeks
we’ve advised investors to take partial profits on positions in leading sectors
such as gold in Euros, Brazil, Mexico, (Latin banks particularly), Japan,
Eastern Europe, Korea, machinery, South Africa, and Canada. We’ve also suggested
that the key thing to watch for to exit these markets is “contagion†where US
market weakness begins to pull even these leaders lower, and suspected this
might occur upon a test of 200 day ma’s by major averages.
The latest week tested the contagion theory and confirmed it. The Dow broke
below its 200 ma on decent volume on Tuesday, and the the first warning sign for
possible contagion developed. That same day saw reversals in Mexico, Brazil,
Japan (though not Korea), Eastern Europe, machinery indexes, South Africa and
Canada. These have gained steam as the market continued to drop into late this
week.

Brazil, Mexico, Japan, Korea, and some of Eastern Europe have so far held above
their 50 day ma’s and look likely to rally some off of these levels. For those
who have not liquidated half of these positions we would hold on until this
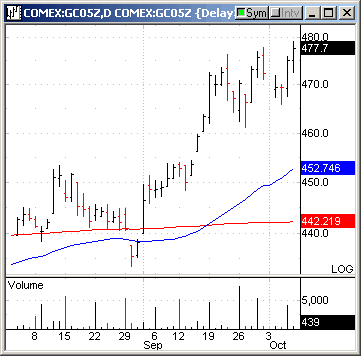
week’s lows and the 50 day give way. Gold and Gold in Euros in particular have
been remarkably strong and should be added to. Gold (not necessarily gold stocks
but
(
GLD |
Quote |
Chart |
News |
PowerRating), futures, and bullion) is likely to do well whether the market
weakness grows or not here we suspect.

The action in the dollar has been critical too. The EUR has once again tested
the critical support level at 1.175-1.2 and bounced off of it on hawkish ECB
rhetoric. While we seriously doubt an ECB rate hike will occur at the next
meeting, it is the dollar yield spread advantage that has fueled the dollar bull
move of this year. IF the EUR can hold at the 1.175-1.2 support level throughout
the end of Fed rate hikes, then the EUR will take off in a new bull move as soon
as the market begins to discount the end of Fed rate hiking. That would fuel a
further move in gold in dollar terms, and be the time to the short EUR part of
the gold/EUR position (as well as the Yen short in gold/yen) we have suggested
investors participate in. Note that even during the EUR’s explosion late this
week, that gold/EUR has held up remarkably well. This appears one of the most
stable investment avenues for a position to us.
We continue to strong advise investors to carefully watch closely important
levels and tests in the specific sectors we have been counting on.
The long-bond test of the
(
TLT |
Quote |
Chart |
News |
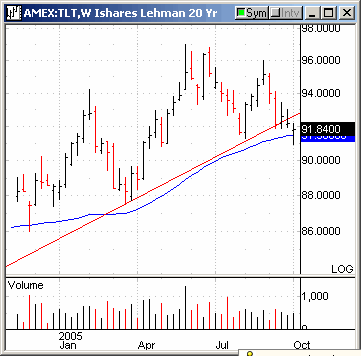
PowerRating) 90.8 level continues undecided here. Bonds
have rallied in the face of equity market weakness somewhat, but we would like
to see a break above the downtrend line in TLT after a successful test of this
91 level on volume before breathing a sigh of relief. Conversely a weak close on
strong volume below 90.8 and the 200 ma by TLTs would likely be HAZARDOUS to US
and global equities.

The Housing Index
(
HGX |
Quote |
Chart |
News |
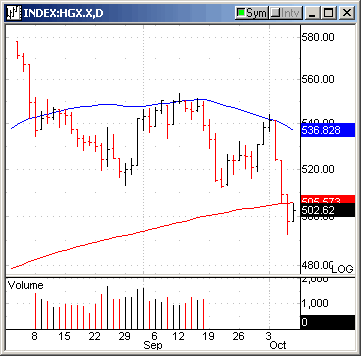
PowerRating) has flashed its warning sign by closing below 500
and its 200 ma. We would like to see an ICF breakdown below 69.3 on good volume
to confirm this move. Should such occur, it will be a sign that housing is going
to be in a bit of trouble, and the refinancing fuel of consumer demand will be
deteriorating. This will further be confirmed as being damaging if the Banking
Index
(
BKX |
Quote |
Chart |
News |
PowerRating) falls below 90. The BKX is already in bearish mode, below its
dropping 50 day and 200 day ma’s. And it has flirted with a Head & Shoulders top
neckline this week. But BKX below 90 will be a clear signal that trouble is
ahead that might be more severe than the soft-landing we’ve been theorizing
about. Retail Holders
(
RTH |
Quote |
Chart |
News |
PowerRating) appear in the same boat. They are in bearish
mode, but will show the potential for more significant economic damage on a
close below 85. Continue to watch.

Let’s add the Naz to our watch list too. The market is bouncing off of Naz 200
day support. A strong volume close below the 200 day ma would be bearish, and
especially bearish would be a strong volume weak close by the Naz below 2039 (QQQQs
below 36.5).
When contagion grips the market, it is no longer the two-way affair we’ve
enjoyed so much in the last few months. For now investors should be mostly in
cash and watching action for better signals that further contagion can be
avoided. Over the last few months we’ve suggested it is a high reward but also
high risk market environment. Let’s take out the high reward now and just say
this is high risk. This week’s fireworks may indeed be it. Those still holding
positions in the strongest sectors can wait for 50 day ma’s to be violated
before moving to the sidelines unless further indications of contagion develop.
But all should have moved more heavily to the sidelines and longer-term
investors should remain on the sidelines until a better risk/reward environment
develops, something we’ve been suggesting nearly all year.
Our model portfolio followed in TradingMarkets.com with specific entry/exit/ops
levels from 1999 through May of 2003 was up 41% in 1999, 82% in 2000, 16.5% in
2001, 7.58% in 2002, and we stopped specific recommendations up around 5% in May
2003 (strict following of our US only methodologies should have had portfolios
up 17% for the year 2003) — all on worst drawdown of under 7%. This did not
include our foreign stock recommendations that had spectacular performance in
2003.
This week in our Top RS/EPS New Highs list published on TradingMarkets.com, we
had readings of 92, 105, 129, 108, and 13 with 29 breakouts of 4+ week ranges,
no valid trades and one close call in SQM. This week, our bottom RS/EPS New Lows
recorded readings of 27, 12, 9, 20, and 52 with 18 breakdowns of 4+ week ranges,
no valid trades and one close call in MWV. One valid long signal remains in
place in VLO on the long side and NDN on the short side. Investors not yet
having taken profits on VLO should use this week’s lows as your ops. The
environment is getting trickier and more treacherous and we are chickens when it
comes to risking principle unless it looks like the weather is clear.
For those not familiar with our long/short strategies, we suggest you review my
book The Hedge Fund Edge, where I discuss many new techniques. Basically, we
have rigorous criteria for potential long stocks that we call “up-fuel,” as well
as rigorous criteria for potential short stocks that we call “down-fuel.” Each
day we review the list of new highs on our “Top
RS and EPS New High List” published on TradingMarkets.com for breakouts of
four-week or longer flags, or of valid cup-and-handles of more than four weeks.
Buy trades are taken only on valid breakouts of stocks that also meet our
up-fuel criteria. Shorts are similarly taken only in stocks meeting our
down-fuel criteria that have valid breakdowns of four-plus-week flags or cup and
handles on the downside. In the U.S. market, continue to only buy or short
stocks in leading or lagging industries according to our group and sub-group new
high and low lists. We continue to buy new long signals and sell short new short
signals until our portfolio is 100% long and 100% short (less aggressive
investors stop at 50% long and 50% short). In early March of 2000, we took
half-profits on nearly all positions and lightened up considerably as a sea of
change in the new-economy/old-economy theme appeared to be upon us. We’ve been
effectively defensive ever since, and did not get to a fully allocated long
exposure even during the 2003 rally. We continue to advise caution and low
allocation and suggest investors nervously watch the market for clues to its
next moves aside from gold/EUR and gold/Yen positions. It will be important to
see if Mexico, Brazil, Korea, and Japan can hold this week’s lows and move
higher, or whether contagion spreads.
Mark Boucher
