Watch for these 2 ETF breakouts
After three days of lighter volume
gains, stocks fell on higher volume yesterday, but an afternoon recovery greatly
reduced the losses. At mid-day, the broad market was at its intraday
low and the Nasdaq Composite was down 1.4%. But stocks rallied steadily off
their lows throughout the afternoon, enabling the Nasdaq to trim its loss to
0.8%. The small-cap Russell 2000 fell 0.6% and the S&P Midcap 400 lost 0.8%. The
S&P 500 followed a similar intraday pattern to the Nasdaq by reducing its 0.9%
intraday loss to only 0.4%. The Dow Jones Industrial Average slipped 0.3%. Each
of the major indices finished in the upper half of their intraday ranges, with
the Dow nearly filling its opening gap down.
Turnover rose across the board yesterday, causing both
exchanges to register bearish “distribution days.” Total volume in the Nasdaq
increased by 17%, while volume in the NYSE was 6% higher than the previous day’s
level. Given that the market moved higher on declining volume in each of the
past three sessions, it was not surprising to see higher overall volume on the
first day of losses that followed. In the S&P, it was the third “distribution
day” within the past four weeks. A healthy market can normally absorb two to
three days of higher volume selling within a one month period, but one or two
more “distribution days” within the next week would certainly weigh on stocks.
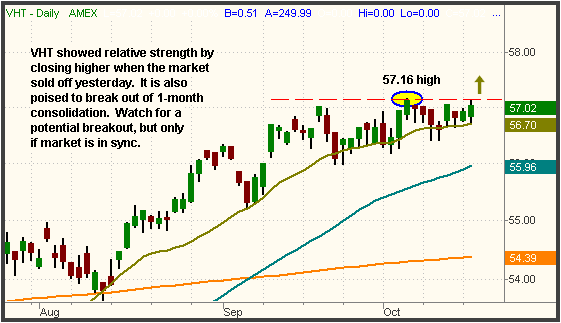
One ETF that ignored yesterday’s weakness and is poised for a
breakout of consolidation is the Vanguard Health Care ETF (VHT):

The October 5 high of $57.16 is the top of the consolidation.
Yesterday, VHT came within a few cents of that high, but failed to actually test
it. Still, it shows solid relative strength that VHT was able to close higher on
a day when all the major indices closed lower. If the market drops over the next
few days, it could prevent VHT from breaking out of its range, but this should
be one of the first ETFs to breakout higher after the market finishes its
correction.
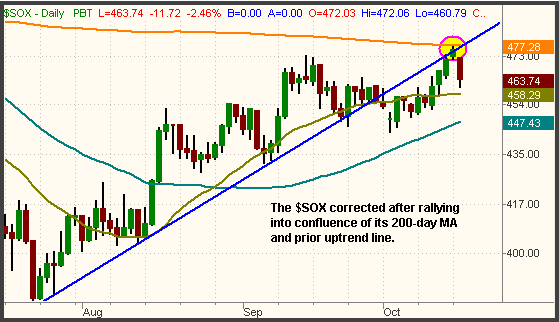
The Semiconductor Index ($SOX) began to show relative strength
a few days ago, but it seems that a confluence of resistance in the index is
taking precedence. As we have discussed extensively in the past, the 200-day
moving average is a very powerful support or resistance level that a stock or
index will rarely break through on its first attempt. On Monday, the $SOX ran
into its 200-day moving average, so it’s not shocking that the index fell 2.5%
yesterday. But converging with that 200-day moving average was resistance of the
prior uptrend line that was broken in the first few days of October. This prior
uptrend line is illustrated as the ascending blue line on the chart below:

Support and resistance levels are always more powerful when
there is confluence. As you can see, the 200-day moving average happened to
converge with resistance of the prior uptrend line, which made it very difficult
for the $SOX to go higher without a correction. Why is is that the prior uptrend
line is now a resistance level? Because the most basic tenet in technical
analysis states that a prior support level becomes the new resistance level
after the support is broken. The chart above is a good example of such.
Yesterday’s action should serve as a warning sign to the
bulls. Granted, the actual losses were rather moderate, but the bigger picture
is that stocks fell on higher volume after three straight days of gains on
declining volume. Remember that volume is the one technical indicator that never
lies or gives false readings because it shows what is really happening “under
the hood” of the market. The market recovered significantly off its lows in the
afternoon, but this type of intraday action at the top of an extended rally is a
sign that the bears are testing the water because the bulls are getting tired.
Like we said two days ago, our near-term bias remains neutral to bearish,
although the charts continue to look bullish for the intermediate-term trends.
Keep those trailing stops in place and remember to
trade what you see, not what you think!
Open ETF positions:
Short KCE (regular subscribers to
The Wagner Daily receive detailed stop and target prices on open
positions and detailed setup information on new ETF trade entry prices. Intraday
e-mail alerts are also sent as needed.)
Deron Wagner is the head
trader of Morpheus Capital Hedge Fund and founder of Morpheus Trading Group (morpheustrading.com),
which he launched in 2001. Wagner appears on his best-selling video, Sector
Trading Strategies (Marketplace Books, June 2002), and is co-author of both The
Long-Term Day Trader (Career Press, April 2000) and The After-Hours Trader
(McGraw Hill, August 2000). Past television appearances include CNBC, ABC, and
Yahoo! FinanceVision. He is also a frequent guest speaker at various trading and
financial conferences around the world. For a free trial to the full version of
The Wagner Daily or to learn about Deron’s other services, visit
morpheustrading.com
or send an e-mail to
deron@morpheustrading.com .
