Watch for Tomorrow’s Fed Statement
Friday left the market with a light
volume narrow range rise on the day. Volume was significantly lower
than Thursday, leaving the markets to await the FOMC on Tuesday. The weekly look
left the NDX with an inside up week. Compx also up on the week and a symmetrical
triangle on the daily chart. SPX green day and week with a shooting star
(potential reversal candle) right into resistance after hitting multi year
highs. The Dow retested the November all time highs to hold and come off that
level into Fridays close.
Monday and Tuesday are likely to be quiet until the FOMC
announcement. So I expect range bound until that time. The statement will be the
focus, because no rate change is expected. Chairman Bernanke’s statement will be
the cause for any market movement and the focus for us to trade around. After
Tuesday’s announcement we’ll focus on Quadruple witching, expiration on Friday.
Which always brings in volatility and also CPI data on Friday will be the
inflation hawks focus this week.
Brokers report this week and that along with Bernanke should
light up the financials giving us a nice outlook for volatility this week. After
going through daily charts I’m seeing some divergences come in, so we need to be
cautious and look for some downside. That light volume rise on Friday leaves us
suspect after Wednesday’s and Thursday’s pullback. However things could be
pretty muted until after FOMC so that may not make a lot of difference.
Economic data for the Week: Monday 10:00 Wholesale
Inventories, Tuesday 08:30 Trade Balance, 02:00 Treasury Budget, 02:15 FOMC
policy Statement, Wednesday 08:30 Business Inventories, 08:30 Retail Sales,
08:30 Retail Sales ex-auto, 10:30 Crude Inventories, Thursday 08:30 Export
Prices ex-ag., 08:30 Import Prices ex-oil, 08:30 Initial Claims, Friday 08:30
CPI, 08:30 Core CPI, 08:30 NY Empire State Index, 09:00 Net Foreign Purchases,
09:15 Capacity Utilization, 09:15 Industrial Production.
Some earnings for the Week: Monday pre market — ALOG and after
the close – QTWW, VRNT. Tuesday pre market – BBY, DG and GS and after the bell –
ADCT, COO, TUTR. Wednesday pre market — nothing and after the bell — ZOLT.
Thursday pre market — APOL, STST, BSC, COST, LEH, WGO and after the bell — ADBE,
TEK, VSTA.
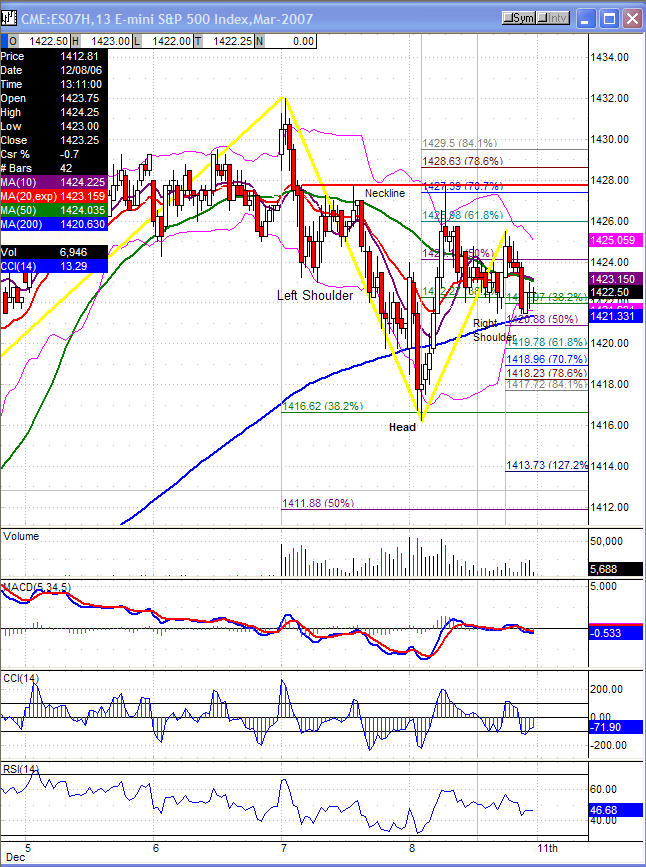
ES (S&P 500 e-mini) Monday’s pivot is 1422.00, the weekly is
1421.25. The chart below shows a possible inverted head and shoulders pattern.
The right shoulder is still being formed so we’ll watch for this as the week
opens. The neckline break 1427.75 would leave us to look for higher ground.
1439.25 would be the measured move on the pattern. Intra day Support: 1419.50,
1418.25, 1416.50, 1411.75 and 1409. Resistance: 1424.50, 1425.75, 1427.75,
1429.5 and 1432. 13 minute chart is below.
Teresa Appleton has traded equities and options for
nine years and futures for seven. She is founder and CEO of TradeLogic, LLC. For
more information about Teresa and the training she offers stock, options and
futures traders,
click here.