Watch Tests Of These Critical Levels
A large number of markets are testing critical levels
that may substantially determine the short-term direction of markets over the
coming weeks.
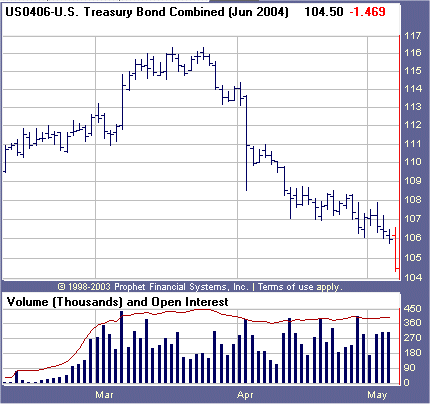
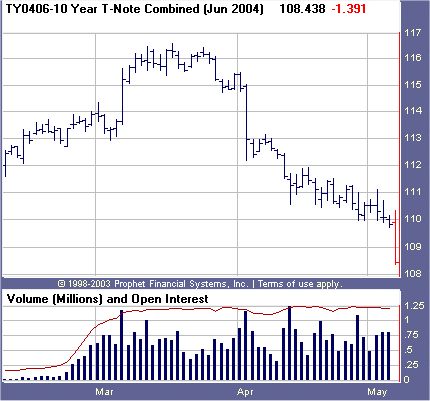
Ten-year bond futures are testing 2003’s lows in the 109 — 110 range
now. An unusually strong employment report on Friday could tip this market into
breaking below this level, which would be quite bearish for stocks and bonds in
the short-term. A strong-volume weak close below 109-08 will be quite negative,
whereas a high-volume strong close in response to a weaker than expected
employment report should set in a bottom in bonds for many weeks and perhaps
months.
Crude oil is also testing critical
resistance. The 40 level turned prices back in 1980 and three times in the last
few years. A high volume strong close above $42 in cash crude would be quite
negative for stocks and would lead to a runup in crude further that could
setback the recovery substantially. Our guess is that 40 will hold at least for
the next few weeks. A strong-volume weak close off of this test of 40 would
indicate a trading range and not enough strength to follow through in crude,
which would be positive for stocks.
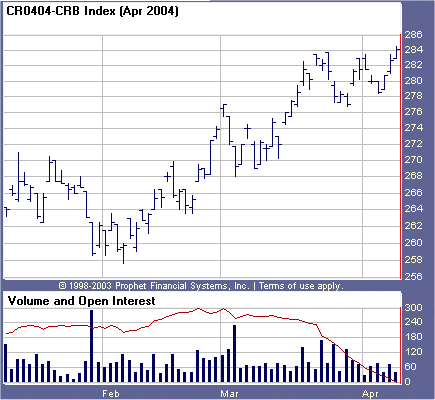
The CRB index is tracing out a potential
head-and-shoulders top, confirming the steep corrections seen in many industrial
commodities for months now. A weak close below 268 will confirm further
downside likely in commodities as China
slows at the same time global growth is decelerating.
^Next^
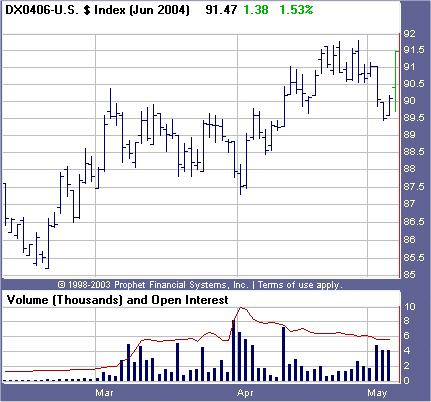
Meanwhile the
Nasdaq is testing its 200 day ma. Here too
investors should look for clear-cut high volume and strong or weak closes to
determine whether this approximate level will hold or not. Obviously a
strong-volume weak close below the 200 ma by the Naz will not bode well for the
market in the near-term.
We suspect that the
resource and commodity correction has further to run — meaning breakdowns in
South Africa and
Mexico will likely continue upon further negative news. On positive
news, follow-through new highs by health care and consumer staples could be used
as a purchase or long-spread against weaker vehicles.
So far our US
long/short model has been relatively inactive during 2004 — only one official
long,
(
CLB |
Quote |
Chart |
News |
PowerRating) — and we continue to suggest investors use some caution until
stocks meeting our criteria expand in breakout breadth. Investors should
continue to cautiously add stock exposure as trade signals are generated that
meet our strict criteria, as well as allocate to our favorite segments on
breakouts and signals as advised above. With our model portfolio having been
essentially in cash since November, it has been frustrating for many — but
market environments like March and April make this position seem wise. These are
tough markets and traders must be nimble and willing to wait for good odds to
risk capital.
Our model portfolio followed in TradingMarkets.com with specific
entry/exit/ops levels from 1999 through May of 2003 was up 41% in 1999, 82% in
2000, 16.5% in 2001, 7.58% in 2002, and we stopped specific recommendations up
around 5% in May 2003 (strict following of our US only methodologies should have
had portfolios up 17% for the year 2003) — all on worst drawdown of under 7%.
This did not include our foreign stock recommendations that had spectacular
performance in 2003.
This week in our
Top
RS/EPS New Highs list published on TradingMarkets.com, we had readings of
13, 7, 22, 30, and 20 with 8 breakouts of 4+ week ranges, no valid trades and no
close calls. Upside breadth deteriorated to neutral this past week. Position
in valid 4+ week trading range breakouts on stocks meeting our criteria or in
close calls that are in clearly leading industries, in a diversified fashion.
This week, our
Bottom RS/EPS New Lows rose from the depths, registering readings of 18, 16,
15, 10, and 10 with 11 breakdowns of 4+ week ranges, no valid trades and one
close call in YBTVA — not yet at levels consistent with good shorting
opportunities, but improving markedly.
For those not familiar with our long/short strategies, we suggest
you review my book
The Hedge Fund Edge,
my course “The Science of Trading,”
my video seminar,
where I discuss many new techniques, and my latest educational product, the
interactive training
module.
Basically, we have rigorous criteria for potential long stocks that we call
“up-fuel,” as well as rigorous criteria for potential short stocks that we call
“down-fuel.” Each day we review the list of new highs on our “Top RS and EPS New
High List” published on TradingMarkets.com for breakouts of four-week or longer
flags, or of valid cup-and-handles of more than four weeks. Buy trades are taken
only on valid breakouts of stocks that also meet our up-fuel criteria.
Shorts are similarly taken only in stocks meeting our down-fuel
criteria that have valid breakdowns of four-plus-week flags or cup and handles
on the downside. In the U.S. market, continue to only buy or short stocks in
leading or lagging industries according to our group and sub-group new high and
low lists. We continue to buy new long signals and sell short new short signals
until our portfolio is 100% long and 100% short (less aggressive investors stop
at 50% long and 50% short). In early March of 2000, we took half-profits on
nearly all positions and lightened up considerably as a sea of change in the
new-economy/old-economy theme appeared to be upon us. We’ve been effectively
defensive ever since, and did not get to a fully allocated long exposure even
during the 2003 rally.
We continue to advise keeping allocations low until the trend is
more certain and the trend is more certain.
Until next week,
Mark Boucher
