Watch The Market At These Critical Periods Today
Premarket futures are Fed up. Currently
trading in the green, it appears that profitable shorts want to cover ahead of
the FOMC report due out at 2:15pm EST.
This morning could offer one directional move
between the open and roughly 11:30am EST. Between 11:30am and 1:30pm is usually
a no-volume, sideways drift. 1:30pm or so begins position squaring ahead of the
report. After the decision and reports are released, anything is possible. Only
skilled, experienced traders should play in the post-FOMC chart wash… it can
get a little western at times!
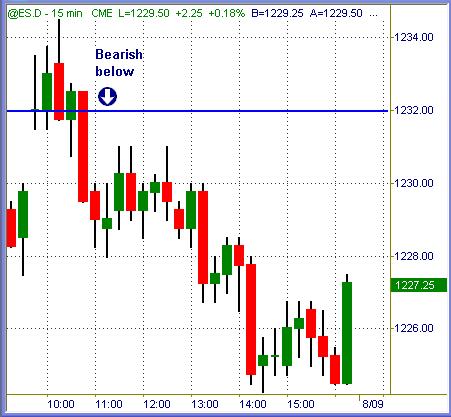
ES (+$50 per index point)
S&P 500 soon traded into bearish territory on
Monday per yesterday’s chart instructions archived in here. A lift to 1231 was
crystal-clear short signal via the method we trade, and it eventually dropped to
1225 for +6pt profit potential from there. After that, it was another sideways
coil into the closing bell.
Today’s outlook will be addressed below.
Â
NQ (+$20 per index point)
Nasdaq 100 also went bearish confirmed and
offered short signals that worked for +15pts. Very modest gains across the
entire range, but rather clear to execute.

Â
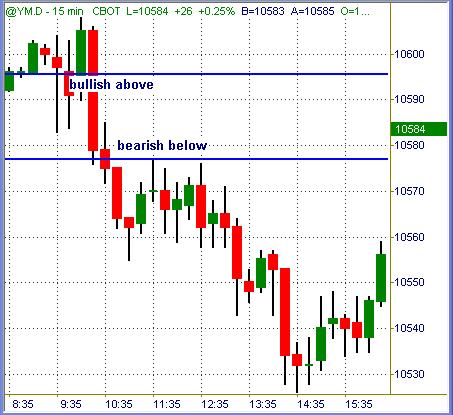
YM (+$5 per index point)
Dow Industrial futures began the morning in
bullish territory, but soon dropped like a rock to join all other symbols. Short
from 10575 to 10525 was the only swing of potential profit that day.
Â
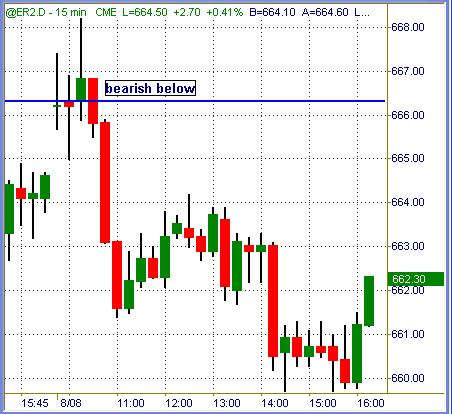
ER (+$100 per index point)
Russell 2000 futures offered short signals near
666 to 662 and again near 664 down to 660 for a pair of +$400 per emini contract
swings. The rest was simply noise in between.
Â
{Price levels posted in charts above are
compiled from a number of different measurements. Over the course of time we
will see these varying levels magnetize = repel price action consistently}
It’s Never Easy
Thank you for the emails yesterday, and please feel free to keep them
coming. Several of them received mentioned how I make intraday trading look so
easy. Far from it. When the opening bell rings and price action seems to gyrate
around, the level of difficulty increases.
I have found that knowing where to gauge
strength or weakness on a chart is important for overall success. Nearly every
time I ignore or “fade” my own tools, it results in loss and another lesson
learned. When I trust the zones visible on my charts, correct trade decisions
and more profitable trades are the result.
Another fact I’ve learned inside the
educational business since early year 2000 is this: the exact method I use will
never be copied by someone else. Every trader who has taken my tools eventually
personalizes it to their own taste. Adding Stochastic values, MACD, CCI, ADX,
volume, candlestick patterns or a host of different tools takes the general
framework I use and “improves” results for some.
We all see the charts differently, and various
setups allow each of us to perform better. The framework of my approach can be a
good bias filter for other methods = systems, or it can be traded purely on its
own as I prefer. Whatever the case may be, trading still requires a degree of
skills that are capable of being learned by anyone, in my opinion.
Summation
The FOMC event will split this session in three sections: potential
morning move, midday lull, post-FOMC gyrations = swings. It makes sense to sit
out the midday section and only trade the afternoon with real money if you are
skilled at fast market, gyrational conditions. I doubt this FOMC event will
cause much stir in the markets, but any such event is capable of blasting the
tapes.
Hey, let’s be careful out there today!
Trade To Win
Austin P
Â
Austin Passamonte is a full-time
professional trader who specializes in E-mini stock index futures, equity
options and commodity markets.
Mr. Passamonte’s trading approach uses proprietary chart patterns found on an
intraday basis. Austin trades privately in the Finger Lakes region of New York.