Watch The Neckline…Here’s Why It’s Key
This
855 – 840 zone for the SPX
(
$SPX.X |
Quote |
Chart |
News |
PowerRating) has been very good to us so far the past three days. But
then again, no surprise because you were ready for any setups in this zone. Both
the SPX and Dow
(
$INDU |
Quote |
Chart |
News |
PowerRating) have taken out their Dec. 31 lows, while the
(
QQQ |
Quote |
Chart |
News |
PowerRating)s haven’t as of yet.
What’s to say? You had
your Trap Door hats on again yesterday morning, and once again, were rewarded by
the early emotional selling which set the table. If you are new to what I do,
but have the
1,2,3 and
First Hour modules, then you caught the two best entries yesterday. The
first was the great Trap Door, with entry above the inside-bar high of 848.80,
then the 1,2,3 higher bottom above the 10:50 a.m. ET signal bar of 848.17. The
SPX carried up to an intraday high of 868.72. The 1,2,3 entry came from a
significant level, as it did the previous day.
Since Monday, the
downside price action has been contained in a tight cluster. On Monday, the lows
were 844.25 and 844.78. On Tuesday, it was 848.56, and yesterday 845.86 and
846.86, which was the signal bar low.
The QQQs had a Trap Door,
a 1,2,3 higher bottom, then a Slim Jim above 24.70, which took it to new
intraday highs. This all took place before 12:30. The QQQs traded up to 25.45
from the initial intraday low of 24.34 on the 9:35 a.m. bar.
Tech outperformed
yesterday, as the QQQs finished at +2.1%, while the Dow ended at +0.3% after
that big early down, and the SPX finished the day at +0.7%. The
(
SMH |
Quote |
Chart |
News |
PowerRating)s were
the tech leaders in clubhouse at +3.1%. In the energy sector, the XOI finished
at +3.4% and the OIH +2.7% as they react to every news headline about Iraq. NYSE
volume was 1.5 billion, a volume ratio of 58, and breadth +434.
The SPX is right under
the head-and-shoulder neckline it recently penetrated, while the Dow neckline is
about 8240 – 8250. There are obviously many stocks with similar setups as the
index and sector proxies yesterday because of normal market correlation, but I
can’t go through the entire litany in this brief commentary. When you prepare
your trading plan from a top-down approach, the market trend is the most
important.
There were wide-range
outside bars yesterday for the
(
SPY |
Quote |
Chart |
News |
PowerRating)s,
(
DIA |
Quote |
Chart |
News |
PowerRating)s and QQQs all with closes
in the top of the range and on decent volume. The SMHs and QQQs closed up on
their most volume since Nov. 21, while the SPY and DIA had their biggest volume
days since Nov. 13.
On the clearly defined
head-and-shoulder patterns you see for the major indices, the right shoulders
all made higher highs than the left shoulders, and on less volume, and the same
can be said for the heads. That tells me that any rally that carries above the
necklines, then reverses to the downside, is a good short setup with a good
risk/reward because your stop is right above the neckline and your entry would
be on the intraday chart and only kept in position if you had a profit cushion
at the end of the day. It’s redundant, but longer-term positions should be
hedged, intraday trades only, unless you get a good opportunity in the major
index proxies. I wouldn’t carry any major stocks overnight.
Have a good trading day.

Five-minute chart of
Wednesday’s SPX with 8-, 20-,
60- and 260-period
EMAs

Five-minute chart of
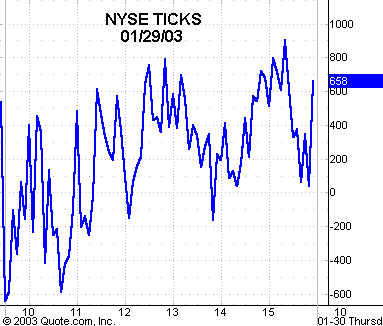
Wednesday’s NYSE TICKS
