Watch these energy and commodity ETFs
As anticipated, the S&P 500, Dow
Jones Industrial Average, and Nasdaq Composite each bounced off support of their
primary uptrend lines yesterday, enabling the major indices to recover last
week’s losses. The Nasdaq Composite rallied 1.5%, the S&P 500 gained
1.1%, and the Dow Jones Industrial Average advanced 1.0%. Small and mid-cap
stocks kept pace with the other indices, but did not outperform as we often see
on many rally days. The Russell 2000 gained 1.4% and the S&P Mid-cap 400 closed
1.1% higher. A minor wave of selling in the final fifteen minutes of trading
caused the broad market to close off its high, but the major indices still
finished in the upper 20% of their intraday ranges. Unfortunately, however,
overall volume was only marginally higher.
Despite yesterday’s firm gains, the low turnover was
disappointing for the bulls. In both the NYSE and Nasdaq, total volume increased
by only 1% over the previous day’s levels. Volume in the NYSE was so light that
it failed to exceed its 50-day average level. The Nasdaq volume barely came in
above its 50-day average. After snapping back sharply from last week’s losses,
one would have expected to see more shares changing hands, but institutions were
not interested in aggressively buying stocks. Since volume was unimpressive on
the upside, keep a close eye on the price to volume relationship in the broad
market throughout the remainder of the week. A sole session of higher volume
losses could easily trigger another correction that would wipe out yesterday’s
gains in short order.
On the first day following a multi-day correction that the
stock market rallies significantly, it’s a good idea to take a look at which
industry sectors showed the most relative strength and weakness. If the top
gainers were sectors that also declined the least when the broad market
corrected, that means leadership came from the sectors with relative strength.
However, sometimes the top gaining sectors on the first bounce following a
selloff will merely be the sectors that got hammered and are merely putting in a
technical bounce. Distinguishing between the two scenarios is important because
you want to only be long the sectors with the most relative strength to the
broad market, not those that recaptured several percent of a large loss
the previous week. Therefore, let’s analyze yesterday’s industry sector action
in order to get a better idea of where the money was flowing.
Of the major industries we follow, the top gainers yesterday
were: Securities Broker-Dealer Index ($XBD), Computer Networking ($NWX),
Transportation ($DJT), Semiconductors ($SOX), and Oil Service ($OSX). Of these,
Transportation is the one sector we would avoid buying because it showed a lot
of relative weakness during last week’s selloff. Semiconductors and Computer
Networking have been choppy and indecisive in both directions, so neither are
good candidates for further upside at this point. The Securities Brokers,
however, have been holding up well in recent weeks, and yesterday’s 2.6% gain
confirmed its relative strength.
The Oil Service Index, which we have discussed extensively
over the past week, has been mounting a stealth rally ever since breaking out
above its five-month downtrend line two weeks ago. After adjusting our
break-even stop back down a bit to allow for a bit of “wiggle room” on October
30, the Oil Service HOLDR
(
OIH |
Quote |
Chart |
News |
PowerRating) hit that stop on November 2. But it
displayed very tricky price action indeed, as it reversed sharply off support of
its 50-day moving average and rallied to a new intraday high later that
afternoon. We viewed the action as the final shakeout attempt before resuming
higher, so we sent a real-time intraday e-mail alert to subscribers, informing
them we were re-entering the OIH position. We bought back in to OIH more than
1.5 points above where we stopped out, but we’re glad we did. As of yesterday’s
close, OIH is showing a gain of nearly 6 points since our re-entry. As long as
the setup is still valid, positions we re-enter often turn out to be our most
profitable trades. Clearly, one has to overcome the human psychological
reluctance to promptly jump back in a position at a higher price than where it
just stopped out.
The Oil Service Index has been showing a lot more relative
strength than the price of the crude oil commodity, but it seems that crude is
now trying to break out of its downtrend as well. If it does, it will present a
short-term trading opportunity for swing traders. The best ETF vehicle to
directly capitalize on a rally in crude oil is the U.S. Oil Fund
(
USO |
Quote |
Chart |
News |
PowerRating),
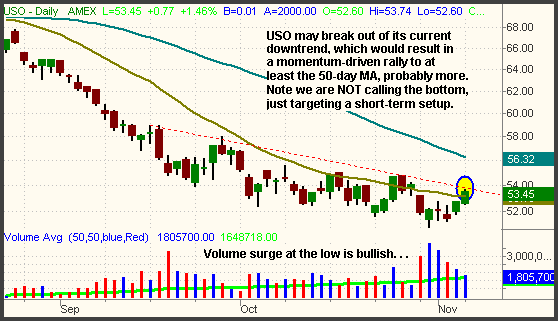
which roughly mirrors the price of the crude oil commodity. Much to the delight
of automobile owners, USO (as a representation of crude oil) has been in a
steady downtrend since peaking on July 14. However, it seems to finally be
putting in at least a short-term bottom. Looking at the daily chart, notice how
USO closed above its 20-day moving average and is poised to break out above its
downtrend line from the September 18 high:

If USO rallies above yesterday’s high, it will have broken out
above its 7-week downtrend line. Such a move should generate further upside
momentum that carries USO at least up to its 50-day moving average, and
most likely a few points beyond that, up to resistance of the September 18 high.
But first, USO must move firmly above yesterday’s high. With this setup, be sure
to understand that we are not calling a bottom in USO because there is
not yet enough price confirmation to do so. Rather, we are merely anticipating a
tradeable bounce from “oversold” conditions in the price of crude oil and USO.
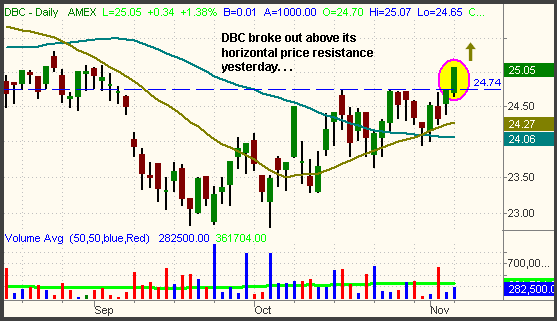
Our long entry in the DB Commodity Trust
(
DBC |
Quote |
Chart |
News |
PowerRating) triggered
yesterday, which will also be aided by further strength in crude oil:

As for the other open positions, the StreetTRACKS Gold Trust
(
GLD |
Quote |
Chart |
News |
PowerRating)
backed off a bit yesterday and has begun to consolidate its recent gains. We
already sold half of our position into strength last Friday, but intend to hold
the remaining shares through its first normal correction that has begun. The
Semiconductor HOLDR
(
SMH |
Quote |
Chart |
News |
PowerRating) rallied against us yesterday, but is still showing
a small unrealized gain. We lowered the stop to reduce our risk yesterday,
because the sector has primarily been choppy.
The S&P, Dow, and Nasdaq did what they were “supposed to do”
by rallying off support of their primary uptrend lines yesterday. However, they
still must contend with the overhead supply from resistance of their October 26
highs. Unless they clear those levels, caution is still advised on the long side
of the market, especially with volume being so light yesterday. The resistance
levels are as follows: S&P 500 – 1,389.45, Dow Jones – 12,167.02, and Nasdaq
Composite – 1,379.29. As always, remember to trade what
you see, not what you think!
Open ETF positions:
Long
(
GLD |
Quote |
Chart |
News |
PowerRating),
(
OIH |
Quote |
Chart |
News |
PowerRating),
(
DBC |
Quote |
Chart |
News |
PowerRating), short
(
SMH |
Quote |
Chart |
News |
PowerRating) (regular subscribers to
The Wagner Daily receive detailed stop and target prices on open
positions and detailed setup information on new ETF trade entry prices. Intraday
e-mail alerts are also sent as needed.)
Deron Wagner is
the head trader of Morpheus Capital Hedge Fund and founder of Morpheus Trading
Group (morpheustrading.com),
which he launched in 2001. Wagner appears on his best-selling video, Sector
Trading Strategies (Marketplace Books, June 2002), and is co-author of both The
Long-Term Day Trader (Career Press, April 2000) and The After-Hours Trader
(McGraw Hill, August 2000). Past television appearances include CNBC, ABC, and
Yahoo! FinanceVision. He is also a frequent guest speaker at various trading and
financial conferences around the world. For a free trial to the full version of
The Wagner Daily or to learn about Deron’s other services, visit
morpheustrading.com
or send an e-mail to
deron@morpheustrading.com .
