Watch Today’s Action Closely — Here’s Why
What Thursday’s Action Tells
You
The Dow
(
$INDU |
Quote |
Chart |
News |
PowerRating) made a new closing
high,
10,750, +0.8% yesterday, on the 13th day of the current rally off the 01/24
low.
The SPX
(
$SPX.X |
Quote |
Chart |
News |
PowerRating) closed at 1197.01, +0.4%, and has been unable to
clear
the 1206 retracement level for the past five days, while the Nasdaq
(
$COMPQ |
Quote |
Chart |
News |
PowerRating), flat, and
(
QQQQ |
Quote |
Chart |
News |
PowerRating), +0.1% to 37.15, continue to show
relative weakness.
NYSE volume was 1.51 billion shares, volume
ratio
58 and breadth just +369. The short-term overbought condition was dissipated
with the sideways price movement of the SPX, and the 4 MA of the volume
ratio is
now 46 and breadth -48. In the sectors, it was all about gold (XAU +3.9%,
energy
(OIH +3.2%) and the overbought TLT, -1.4%.
Traders in the QQQQ caught a retracement move
off
the 36.87 200-day EMA and 36.88 intraday low. The move ran +1.1% to the 240
EMA
(five-minute chart) and 37.32 before fading into the 37.15 close. Sequence
traders recognize that reversal pattern (or should have). If you trade the
(
DIA |
Quote |
Chart |
News |
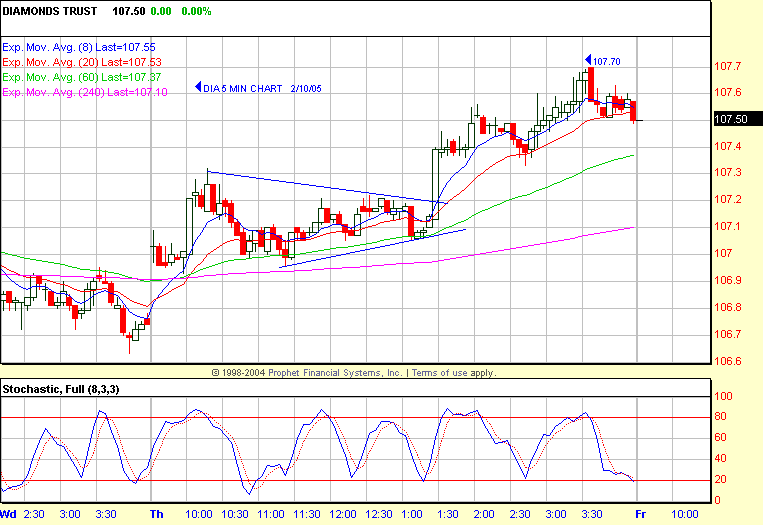
PowerRating)s/YMs, you caught the triangle breakout above 107.20, which traded
to
107.70, closing at 107.50. The DIAs had a much better intraday relative
strength
vs. the SPX which made a double bottom at 119.25. The DIA gapped up on the
open
and did not even had a gap pullback, so the trade decision was easy. Suffice
to
say the energy focus list yesterday was a major profit center once again for
daytraders.
Next week is a time zone, and until the SPX
1217.90 and Dow 10,869 highs are taken out, both remain in 1,2,3 Lower Top
patterns, so depending on today’s action, that could mean a switch in the
bias
next week.
Have a good trading day,
Kevin Haggerty

Â
