Wednesday’s Stock Watch
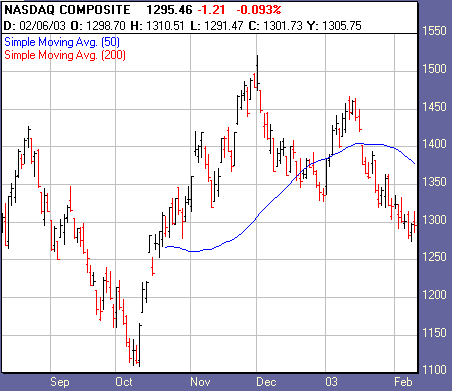
The major indexes kicked
off the week with new lows for the year, and Tuesday the NYSE and
Nasdaq exchanges posted distribution days. So things are down. With no spark to
trigger a rally, price action maintains its steady decline as fears of conflict
with Iraq hold down sentiment.
In the breadth department, new-52-week Lows are
maintaining their bias over a nearly nonexistent Highs list. Volume in general
has been light. Upside leadership remains another absent factor.
The four remaining stocks on our watch list are
holding up well. When the market eventually turns up, we will look to issues
like GRMN that represent the best in technical and fundamental properties to be
the next stars.
From Tuesday’s action:
Market breadth was mostly negative, with NYSE
declining issues over advancing issues by a ratio of 1.44, and down volume over
up volume by a 2.30 ratio. Nasdaq declining issues over advancing issues came in
at 1.18, and up volume beat down volume by a 1.21 ratio.
Dow Jones Industrial Average
(
$INDU.X |
Quote |
Chart |
News |
PowerRating)
closed -0.97%
at 7,843.11. The S&P 500
(
$SPX.X |
Quote |
Chart |
News |
PowerRating)
closed -0.80% at
829.21.
The Nasdaq
(
$COMPQ |
Quote |
Chart |
News |
PowerRating) closed
-0.09% at
1,295.51.

1,264
1,474
Declining Issues
1,807
1,753
406,525,000
649,532,000
846,468,000
629,249,000
Total
Volume
1,273,034,000
1,235,674,000
Highs
6
3
58
20
Top sectors:
Gold and Silver, Internet, Software, Cable TV/Satelite,
and Drugs.
Watch List Action:
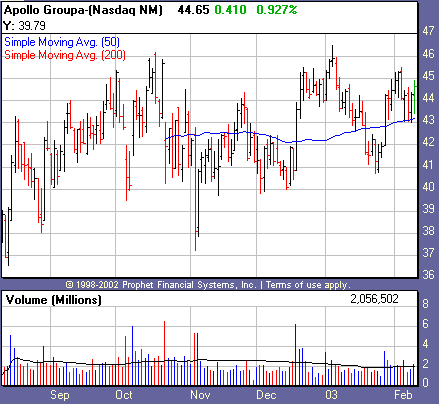
Once again in defiance of overall market action, Apollo Group
(
APOL |
Quote |
Chart |
News |
PowerRating) showed
relative strength as it put in an accumulation day Tuesday. The stock maintains
its position above its 50-day moving average, and remains poised for a breakout.

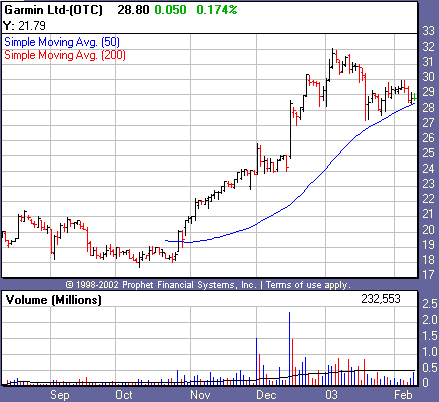
Also defying the overall market with an accumulation day was Garmin Ltd.
(
GRMN |
Quote |
Chart |
News |
PowerRating).
Stocks that go against the grain of the markets as a whole tend to be big
winners when things turn up. This stock has been a great performer for us, and
is trading right on its 50-day moving average.

Recent Breakouts
size=2>We monitor the action of Recent Breakouts as an indicator of
the market health for IT traders. When breakouts are acting well, this is a good
sign for the likelihood of further sustainable breakouts. When breakouts are
failing, IT traders should be even more cautious.
| color=#ffffff size=2>Company Name | color=#ffffff size=2>Symbol | color=#ffffff size=2>12 Month RS | color=#ffffff size=2>Price | color=#ffffff size=2>Price Change | color=#ffffff size=2>Average Volume | Pivot | 52-Week High |
Coach Inc. | ( COH | Quote | Chart | News | PowerRating) | 87 | 31.33 | -0.08 | 991,100 | 28.35 | 35.70 |
Garmin Ltd. | ( GRMN | Quote | Chart | News | PowerRating) | 94 | 28.80 | +0.05 | 489,500 | 28.66 | 32.07 |
International Game Technology | ( IGT | Quote | Chart | News | PowerRating) | 83 | 74.99 | -0.21 | 1,121,100 | 74.84 | 80.10 |
Stocks Forming a Handle
| color=#ffffff size=2>Company Name | color=#ffffff size=2>Symbol | color=#ffffff size=2>12 Month RS | color=#ffffff size=2>Price | color=#ffffff size=2>Price Change | color=#ffffff size=2>Average Volume | Pivot |
Apollo Group | ( APOL | Quote | Chart | News | PowerRating) | 89 | 44.66 | +0.42 | 1,955,600 | 45.60 |
Stocks Building A Base
color=#ffffff size=2>Company Name | color=#ffffff size=2>Symbol | color=#ffffff size=2>12 Month RS | color=#ffffff size=2>Price | color=#ffffff size=2>Price Change | color=#ffffff size=2>Average Volume | Pivot |
None | Â | Â | Â | Â | Â | Â |
Daniel Beighley
href=”mailto:danielb@tradingmarkets.com”>danielb@tradingmarkets.com
If you are new to the “IT” strategy, be sure to
take a look at our
intermediate-term online trading course.
Intermediate-Term Traders
Report is posted on
Tuesdays and Fridays. For other intermediate-term commentary, be sure to read
Mark Boucher (Fridays),
Tim Truebenbach (Tuesdays and Thursdays), and
Gary Kaltbaum (Mondays and Thursdays).
