Wednesday’s Stock Watch
Since our last report
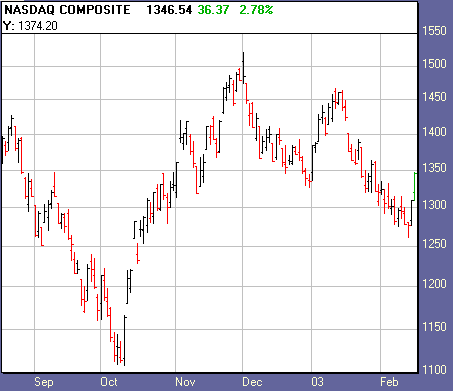
Friday, the major averages have put in an impressive day to the upside.
No reason to get too excited though, volume was below average, and very little
has changed in the big picture.
We will be looking for a follow through day from
Thursday’s low between this Wednesday and Monday. This will be in the form of at
least one of the major indexes up 2% on high volume as an indication of
institutional support.Â
We have added three new stocks to our handles lists.
These breakout candidates all match our top fundamental and technical criteria,
though significant flaws in the technical patterns are evident. Buying is
cautioned against. Patterns aside, this still remains a very dicey market to
consider the long side. Use this report as a measure of overall market strength.
When you see us able to add new candidates here, it will be a sign things are
turning up.
From Tuesday’s action:
Market breadth was positive, with NYSE
advancing issues over declining issues by a ratio of 2.56, and up volume over
down volume by a 5.97 ratio. Nasdaq advancing issues over declining issues came
in at 2.02, and up volume beat down volume by a 7.23 ratio.
Dow Jones Industrial Average
(
$INDU.X |
Quote |
Chart |
News |
PowerRating)
closed +1.67%
at 8,041.15. The S&P 500
(
$SPX.X |
Quote |
Chart |
News |
PowerRating)
closed +1.94% at
851.17.
The Nasdaq
(
$COMPQ |
Quote |
Chart |
News |
PowerRating) closed +2.77% at
1,346.54.

2,237
2,179
Declining Issues
842
1,084
994,345,000
1,142,487,000
169,853,000
158,649,000
Total
Volume
1,168,095,000
1,316,674,000
Highs
10
7
9
9
Top sectors:
Gold and Silver, Internet, Software, Cable TV/Satelite,
and Drugs.
Watch List Action:
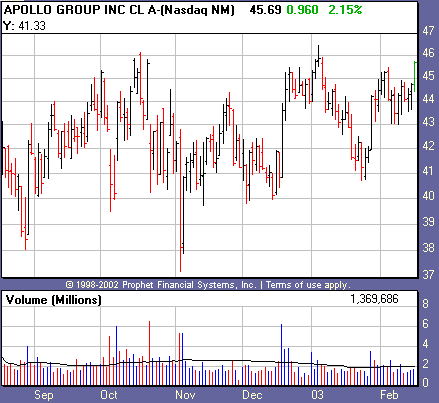
Putting in a solid day to the upside, Apollo Group
(
APOL |
Quote |
Chart |
News |
PowerRating) has moved through
its pivot buy, though has not made the 40% increase in daily average volume
needed for a buy trigger. A volume surge could potentially come tomorrow. Stocks
like this that have had great runs tend to tire out after three base breakouts,
so any weakness in here could be indication that it’s run is over.

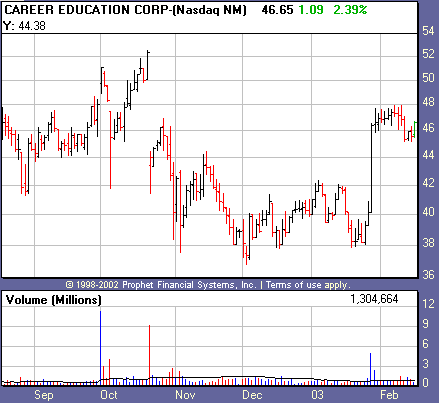
Coming back on our list is Career Education Corp.
(
CECO |
Quote |
Chart |
News |
PowerRating). This is another
example of a stock that had a run of at least three base breakouts, and is also
cautioned against buying. The choppy pattern here is reason enough to be weary.
We’ll watch and see how it turns out.

Recent Breakouts
size=2>We monitor the action of Recent Breakouts as an indicator of
the market health for IT traders. When breakouts are acting well, this is a good
sign for the likelihood of further sustainable breakouts. When breakouts are
failing, IT traders should be even more cautious.
| color=#ffffff size=2>Company Name | color=#ffffff size=2>Symbol | color=#ffffff size=2>12 Month RS | color=#ffffff size=2>Price | color=#ffffff size=2>Price Change | color=#ffffff size=2>Average Volume | Pivot | 52-Week High |
Coach Inc. | ( COH | Quote | Chart | News | PowerRating) | 86 | 32.80 | +1.02 | 991,100 | 28.35 | 35.70 |
Garmin Ltd. | ( GRMN | Quote | Chart | News | PowerRating) | 95 | 33.02 | +2.15 | 489,500 | 23.46 | 32.07 |
International Game Technology | ( IGT | Quote | Chart | News | PowerRating) | 82 | 76.52 | +0.65 | 1,121,100 | 74.84 | 80.10 |
Stocks Forming a Handle
| color=#ffffff size=2>Company Name | color=#ffffff size=2>Symbol | color=#ffffff size=2>12 Month RS | color=#ffffff size=2>Price | color=#ffffff size=2>Price Change | color=#ffffff size=2>Average Volume | Pivot |
Apollo Group | ( APOL | Quote | Chart | News | PowerRating) | 89 | 45.69 | +0.96 | 1,955,600 | 45.60 |
CECO | ( CECO | Quote | Chart | News | PowerRating) | 83 | 46.65 | +1.09 | 882,100 | 48.07 |
Expeditors International of Washington | ( EXPD | Quote | Chart | News | PowerRating) | 81 | 33.31 | +0.81 | 909,300 | 34.54 |
UCBH Holdings | ( UCBH | Quote | Chart | News | PowerRating) | 82 | 42.96 | +0.05 | 181,300 | 45.20 |
Stocks Building A Base
color=#ffffff size=2>Company Name | color=#ffffff size=2>Symbol | color=#ffffff size=2>12 Month RS | color=#ffffff size=2>Price | color=#ffffff size=2>Price Change | color=#ffffff size=2>Average Volume | Pivot |
None | Â | Â | Â | Â | Â | Â |
If you are new to the “IT” strategy, be sure to
take a look at our
intermediate-term online trading course.
Intermediate-Term Traders
Report is posted on
Tuesdays and Fridays. For other intermediate-term commentary, be sure to read
Mark Boucher (Fridays),
Tim Truebenbach (Tuesdays and Thursdays), and
Gary Kaltbaum (Mondays and Thursdays).
