Wednesday’s Stock Watch
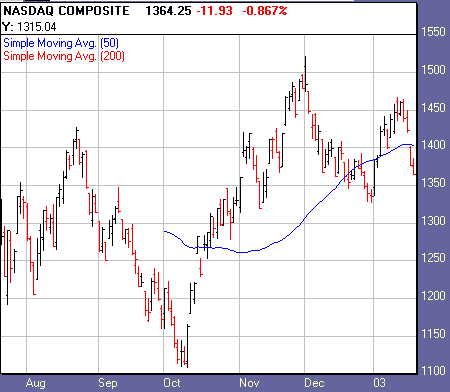
After taking Monday off, the market re-opened Tuesday to extend last week’s
losses. Positive earnings news from key Dow components Johnson & Johnson, 3M
and Citibank failed to inspire, as concerns over conflict in Iraq continued. The
major indexes are now within shouting distance of the bottoms of their
three-month ranges.
Some of the stocks on our watch list came into distribution trouble Tuesday, as
many leading stocks across the markets moved below their 50-day moving averages.
It’s usually not a good sign when the strong stocks start breaking down. This
report is a measure of market strength, if nothing else, in a bear market. The
lack of qualified candidates to report here is indication enough that this
market is no good.
Stocks from our watch list put in distribution days
for the week, though held ground. Remember, we’re only looking for stocks meeting
our top technical and fundamental criteria as taught in our
intermediate-term online trading course. The search goes on!
From Tuesday’s action:
Market breadth was negative, with NYSE
declining issues over advancing issues by a ratio of 2.23, and down volume over
up volume by a 5.71 ratio. Nasdaq declining issues over advancing issues came in
at 1.69, and down volume beat up volume by a 1.79 ratio.
The Dow Jones Industrial Average
(
$INDU.X |
Quote |
Chart |
News |
PowerRating)
closed -1.67%
at 8,442.90. The S&P 500
(
$SPX.X |
Quote |
Chart |
News |
PowerRating)
closed -1.57% at
887.62. The Nasdaq
(
$COMPQ |
Quote |
Chart |
News |
PowerRating) closed -0.86% at
1,364.27.

979
1,220
Declining Issues
2,138
2,062
199,356,000
400,144,000
1,076,458,000
1,342,150,000
Total
Volume
1,280,116,000
955,624,000
Highs
5
8
11
10
Top sectors:
Fiber Optics, Internet, Computer Security, Telecoms, and Gold
and Silver.
Watch List Action:
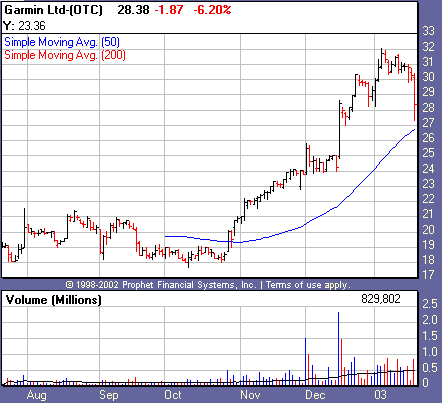
Putting in another day of distribution, Garmin Ltd.
(
GRMN |
Quote |
Chart |
News |
PowerRating) sold off below
its 20-day moving average, leaving a tail just above its 50-day moving average.
Three days of heavy distribution within two weeks spells trouble here. This
stock has had a great run so far and has all the qualities (except a good
market) that we look for in IT candidates. We’ll continue to track this as it
trades well above its pivot buy point. Next stop below is the 50-day moving
average.

From our handles list, Apollo Group
(
APOL |
Quote |
Chart |
News |
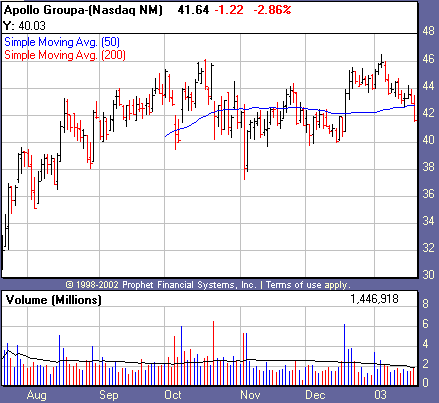
PowerRating) put in a day of distribution as
it sold off below its 50-day moving average. Often bullish patterns, such as the
cup-and-handle this one was in, will have sharp moves in the opposite when they
come undone. APOL has been one of the few successful long candidates in this
bear market, though it appears as though it just doesn’t have enough to launch
from another base.

Recent Breakouts
size=2>We monitor the action of Recent Breakouts as an indicator of
the market health for IT traders. When breakouts are acting well, this is a good
sign for the likelihood of further sustainable breakouts. When breakouts are
failing, IT traders should be even more cautious.
| color=#ffffff size=2>Company Name | color=#ffffff size=2>Symbol | color=#ffffff size=2>12 Month RS | color=#ffffff size=2>Price | color=#ffffff size=2>Price Change | color=#ffffff size=2>Average Volume | Pivot | 52-Week High |
Coach Inc. | ( COH | Quote | Chart | News | PowerRating) | 87 | 29.17 | -1.09 | 872,300 | 28.35 | 35.70 |
Garmin Ltd. | ( GRMN | Quote | Chart | News | PowerRating) | 95 | 28.38 | -1.88 | 404,400 | 23.46 | 31.35 |
Hovnanian Enterprises | ( HOV | Quote | Chart | News | PowerRating) | 79 | 33.02 | -0.27 | 597,000 | 33.56 | 40.56 |
International Game Technology | ( IGT | Quote | Chart | News | PowerRating) | 86 | 77.20 | +0.02 | 869,800 | 66.70 | 80.10 |
Stocks Forming a Handle
| color=#ffffff size=2>Company Name | color=#ffffff size=2>Symbol | color=#ffffff size=2>12 Month RS | color=#ffffff size=2>Price | color=#ffffff size=2>Price Change | color=#ffffff size=2>Average Volume | Pivot |
Expedia | ( EXPE | Quote | Chart | News | PowerRating) | 86 | 63.61 | -2.58 | 2,432,900 | 78.72 |
Apollo Group | ( APOL | Quote | Chart | News | PowerRating) | 82 | 41.64 | -1.23 | 2,258,700 | 46.57 |
Stocks Building A Base
color=#ffffff size=2>Company Name | color=#ffffff size=2>Symbol | color=#ffffff size=2>12 Month RS | color=#ffffff size=2>Price | color=#ffffff size=2>Price Change | color=#ffffff size=2>Average Volume | Pivot |
None |
href=”mailto:danielb@tradingmarkets.com”>danielb@tradingmarkets.com
If you are new to the “IT” strategy, be sure to
take a look at our
intermediate-term online trading course.
Intermediate-Term Traders
Report is posted on
Tuesdays and Fridays. For other intermediate-term commentary, be sure to read
Mark Boucher (Fridays),
Tim Truebenbach (Tuesdays and Thursdays), and
Gary Kaltbaum (Mondays and Thursdays).
