Wednesday’s Stock Watch
It’s pre-holiday trading,
and Tuesday the major indexes took a step back from recent gains.
Volume was slightly above average, though not enough to mark distribution. After
breaking out of multi-week bases, the question now for the major indexes is
whether or not it will hold, or end up like most breakouts for the past two
years and fall apart. We’ll let the market answer for us.
Market breadth continues to leave much to be desired. New
52-week highs are holding an edge over the lows, though the numbers are
relatively small. Mark Boucher‘s
Top
RS and ER List and
Bottom RS and ER List also remain sluggish. Watch for readings of over
20 on each list to show strength for their respective biases.
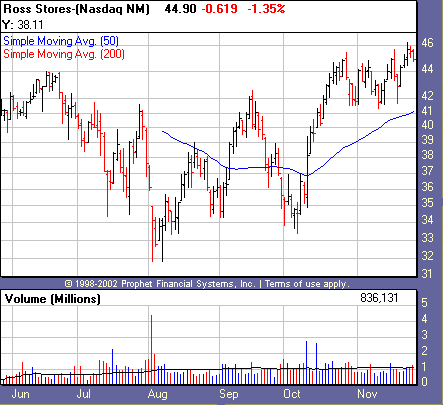
Stocks on our “handles” list are acting sluggish,
with both EXPE and ROST hitting pivot buy points, though failing to produce the
volume need to generate a trigger. Not a good sign. These stocks are potential
leadership candidates, and without their success it’s difficult to vie for the
long side. Despite the negatives, recent signs of accumulation, coupled with the
market’s ability to shake bad news shows some promise. We take it as it comes.
From Friday’s action:
Market breadth was slightly positive, with NYSE
advancing issues over declining issues by a ratio of 1.24, and up volume over
down volume by a 1.00 ratio. Nasdaq advancing issues over declining issues came
in at 1.19, and up volume beat down volume by a 1.05 ratio.
Dow Jones Industrial Average
(
$INDU.X |
Quote |
Chart |
News |
PowerRating)
closed -0.45%
at 8,804.84. The S&P 500
(
$SPX.X |
Quote |
Chart |
News |
PowerRating)
closed -0.34% at
930.55.
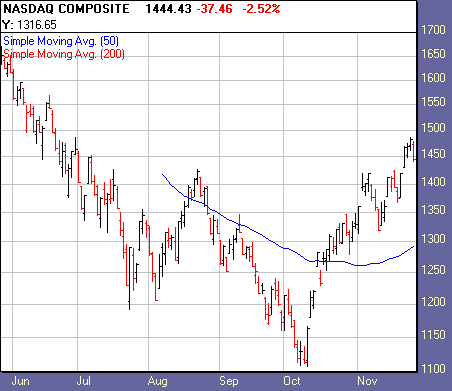
The Nasdaq
(
$COMPQ |
Quote |
Chart |
News |
PowerRating) closed
+0.08% at
1,468.73.
1,092
1,292
Declining Issues
1,972
2,067
298,402,000
429,767,000
1,164,715,000
1,449,068,000
Total
Volume
1,473,491,000
1,912,539,000
Highs
6
12
10
3
Top sectors:
Broker/dealer, Software, Internet, Telecoms,
Semiconductors.
Long-term: Gold, Defense, Leisure, Consumer.
Watch List Action:
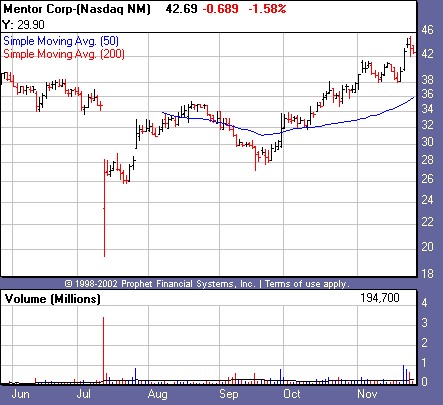
One of our most recent breakouts, Mentor Corp.
(
MNTR |
Quote |
Chart |
News |
PowerRating), is now pulling back
from recent highs. The stock’s down moves are accompanied by lower volume, which
is exactly what we want to see.
Nearly breaking out, Ross Stores
(
ROST |
Quote |
Chart |
News |
PowerRating), hit its pivot point though failed
to produce enough volume needed to trigger a buy. Unless we see the stock
achieve at least 140% of its daily average volume, we don’t want to be buyers.
High volume equals institutional support, and that’s something we don’t want to
be on the wrong side of.
Recent Breakouts
size=2>We monitor the action of Recent Breakouts as an indicator of
the market health for IT traders. When breakouts are acting well, this is a good
sign for the likelihood of further sustainable breakouts. When breakouts are
failing, IT traders should be even more cautious.
| color=#ffffff size=2>Company Name | color=#ffffff size=2>Symbol | color=#ffffff size=2>12 Month RS | color=#ffffff size=2>Price | color=#ffffff size=2>Price Change | color=#ffffff size=2>Average Volume | Pivot | 52-Week High |
Apollo Group | ( APOL | Quote | Chart | News | PowerRating) | 91 | 41.39 | -2.30 | 2,555,100 | 39.60 | 46.15 |
Coach Inc. | ( COH | Quote | Chart | News | PowerRating) | 96 | 32.41 | -0.81 | 936,500 | 29.80 | 34.23 |
Garmin Ltd. | ( GRMN | Quote | Chart | News | PowerRating) | 87 | 23.87 | -0.22 | 173,100 | 23.46 | 24.25 |
Hovnanian Enterprises | ( HOV | Quote | Chart | News | PowerRating) | 95 | 32.50 | -1.09 | 771,100 | 33.56 | 40.56 |
International Game Technology | ( IGT | Quote | Chart | News | PowerRating) | 91 | 77.27 | -2.02 | 1,099,000 | 75.47 | 79.51 |
Mentor Corp. | ( MNTR | Quote | Chart | News | PowerRating) | 93 | 42.69 | -0.69 | 239,700 | 41.50 | 45.01 |
Stocks Forming a Handle
| color=#ffffff size=2>Company Name | color=#ffffff size=2>Symbol | color=#ffffff size=2>12 Month RS | color=#ffffff size=2>Price | color=#ffffff size=2>Price Change | color=#ffffff size=2>Average Volume | Pivot |
Commerce Bancorp. | ( CBH | Quote | Chart | News | PowerRating) | 70 | 45.02 | -0.39 | 770,500 | 47.90 |
Expedia | ( EXPE | Quote | Chart | News | PowerRating) | 97 | 74.88 | -2.50 | 2,671,400 | 78.29 |
Ross Stores Inc. | ( ROST | Quote | Chart | News | PowerRating) | 93 | 44.90 | -0.62 | 1,075,200 | 46.31 |
EXPE hit its pivot buy, though failed to produce
the volume need to qualify a breakout.
Stocks Building A Base
color=#ffffff size=2>Company Name | color=#ffffff size=2>Symbol | color=#ffffff size=2>12 Month RS | color=#ffffff size=2>Price | color=#ffffff size=2>Price Change | color=#ffffff size=2>Average Volume | Pivot |
None |
href=”mailto:danielb@tradingmarkets.com”>danielb@tradingmarkets.com
If you are new to the “IT” strategy, be sure to
take a look at our
intermediate-term online trading course.
Intermediate-Term Traders
Report is posted on
Tuesdays and Fridays. For other intermediate-term commentary, be sure to read
Mark Boucher (Fridays),
Tim Truebenbach (Tuesdays and Thursdays), and
Gary Kaltbaum (Mondays and Thursdays).