Wednesday’s Stock Watch
Tuesday’s action proved to
be positive for the indexes, though volume remains below average on the major
exchanges. Monday marked slight distribution for the NYSE. We are
looking for volume signals to help us identify where the institutional money is
going. It is a good sign to see sellers dry up on down swings, though December
is a traditionally light time of year.
Market breadth is singing the same old song, as the
bulls struggle to gain a solid edge over the lows. New 52-week lists are quiet
on both ends, and Mark Boucher‘s
Top
RS and ER List overshadows a nearly nonexistent
Bottom RS and ER List, though has failed to produce 20+ bullish readings for
the last couple of sessions.
We are now removing a couple of selections off our
watch lists, and unfortunately research has been unable to produce new names.
Patience is crucial for intermediate-term trading, we just have to sit back and
let the market prove itself to us.
From Tuesday’s action:
Market breadth was positive, with NYSE
advancing issues over declining issues by a ratio of 2.16, and up volume over
down volume by a 3.49 ratio. Nasdaq advancing issues over declining issues came
in at 1.54, and up volume beat down volume by a 4.25 ratio.
Dow Jones Industrial Average
(
$INDU.X |
Quote |
Chart |
News |
PowerRating)
closed +1.19%
at 8,574.26. The S&P 500
(
$SPX.X |
Quote |
Chart |
News |
PowerRating)
closed +1.39% at
904.41.
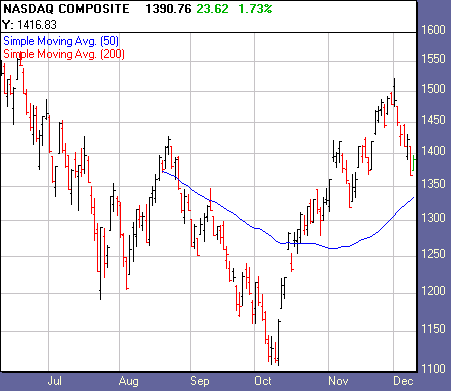
The Nasdaq
(
$COMPQ |
Quote |
Chart |
News |
PowerRating) closed +1.70% at
1,390.48.

Â
2,094
2,012
Declining Issues
927
1,323
947,612,000
1,184,483,000
269,657,000
277,931,000
Total
Volume
1,227,854,000
1,475,220,000
Highs
7
6
4
9
Top sectors:
Gold, Defense, Consumer, Leisure.
Watch List Action:
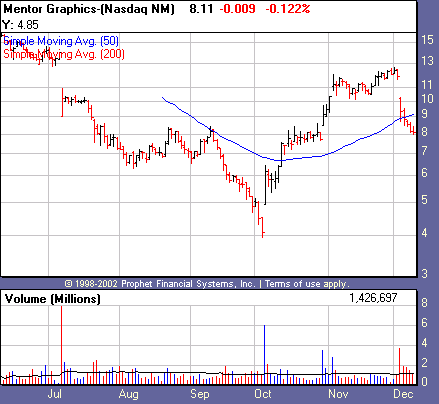
One of our recent breakouts, Mentor Graphics
(
MNTR |
Quote |
Chart |
News |
PowerRating), has revisited its
50-day moving average with a sell-off of just over 10% below its pivot
buy point. This stock will be coming off the list. It would have come off
earlier, though we gave it a chance as a bullish tail was made on the daily bar
when it last traded this low. Just another breakout casualty.

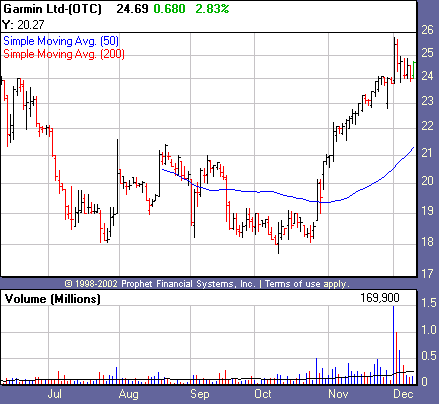
Still strong, Garmin Ltd.
(
GRMN |
Quote |
Chart |
News |
PowerRating) continues to trace out a handle. Tuesday’s
volume marks slight accumulation, as the stock closed at the top of its daily
range.

Recent Breakouts
size=2>We monitor the action of Recent Breakouts as an indicator of
the market health for IT traders. When breakouts are acting well, this is a good
sign for the likelihood of further sustainable breakouts. When breakouts are
failing, IT traders should be even more cautious.
| color=#ffffff size=2>Company Name | color=#ffffff size=2>Symbol | color=#ffffff size=2>12 Month RS | color=#ffffff size=2>Price | color=#ffffff size=2>Price Change | color=#ffffff size=2>Average Volume | Pivot | 52-Week High |
Coach Inc. | ( COH | Quote | Chart | News | PowerRating) | 91 | 32.21 | +1.26 | 958,500 | 29.80 | 35.70 |
Garmin Ltd. | ( GRMN | Quote | Chart | News | PowerRating) | 83 | 24.69 | +0.68 | 249,600 | 23.46 | 25.80 |
Hovnanian Enterprises | ( HOV | Quote | Chart | News | PowerRating) | 88 | 31.10 | -1.68 | 771,100 | 33.56 | 40.56 |
International Game Technology | ( IGT | Quote | Chart | News | PowerRating) | 87 | 75.85 | +0.22 | 1,099,000 | 75.47 | 80.10 |
Mentor Corp. | ( MNTR | Quote | Chart | News | PowerRating) | 91 | 38.63 | -0.97 | 283,600 | 41.50 | 45.45 |
MNTR will coming off the list.
Stocks Forming a Handle
| color=#ffffff size=2>Company Name | color=#ffffff size=2>Symbol | color=#ffffff size=2>12 Month RS | color=#ffffff size=2>Price | color=#ffffff size=2>Price Change | color=#ffffff size=2>Average Volume | Pivot |
Commerce Bancorp. | ( CBH | Quote | Chart | News | PowerRating) | 64 | 44.25 | +0.83 | 723,500 | 47.90 |
Expedia | ( EXPE | Quote | Chart | News | PowerRating) | 95 | 70.74 | -0.38 | 2,854,400 | 78.72 |
Ross Stores Inc. | ( ROST | Quote | Chart | News | PowerRating) | 88 | 43.70 | -0.05 | 1,075,200 | 47.34 |
CBH will be coming off the list as its 12 month
RS has dropped to 64.
Stocks Building A Base
color=#ffffff size=2>Company Name | color=#ffffff size=2>Symbol | color=#ffffff size=2>12 Month RS | color=#ffffff size=2>Price | color=#ffffff size=2>Price Change | color=#ffffff size=2>Average Volume | Pivot |
Apollo Group | ( APOL | Quote | Chart | News | PowerRating) | 86 | 41.21 | -0.05 | 2,494,900 | 44.46 |
href=”mailto:danielb@tradingmarkets.com”>danielb@tradingmarkets.com
If you are new to the “IT” strategy, be sure to
take a look at our
intermediate-term online trading course.
Intermediate-Term Traders
Report is posted on
Tuesdays and Fridays. For other intermediate-term commentary, be sure to read
Mark Boucher (Fridays),
Tim Truebenbach (Tuesdays and Thursdays), and
Gary Kaltbaum (Mondays and Thursdays).
