Wednesday’s Stock Watch
Volume was exceptionally
light for the week, as trading went into pre-holiday mode. Friday’s
session wraps up the first positive month in five for the S&P 500, while the Dow
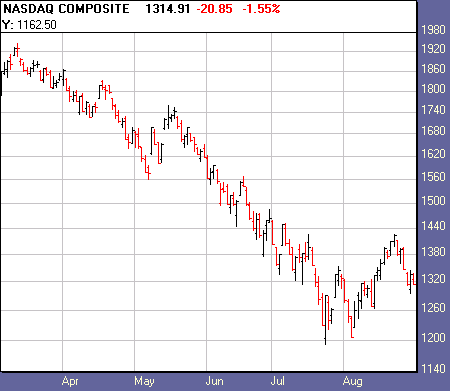
continues along its five-month decline, and the Nasdaq its seven-month slide.
For the past month, the NYSE has made four accumulation days, and three
distribution days, while the Nasdaq has made five accumulation days and two
distribution days. Next Tuesday traders are looking forward to volume coming
back to normal as the fall season comes in and a clearer picture of sentiment
is defined.
Leadership of late has been in gold stocks, while
airlines, semiconductors and biotechnology are exhibiting the weakness. New
52-week highs and lows have been posting low numbers in recent sessions, and
Mark Boucher‘s
Top
RS and ER List and
Bottom RS and ER List lean slightly bearish.
This report had one breakout for the week with many
stocks still setup in bullish handle patterns. Technically, we have the
accumulation days put in to believe we may see a run to the upside, but the fact
remains we’re still in a bear market. Until we see breakouts succeeding, there
is no reason to jump in and test the situation. Patience can do wonders as far
as preserving capital.
From Tuesday’s action:
Market breadth was mixed, with NYSE
advancing issues over declining issues by a ratio of 1.38, and up-volume over
down-volume by a 1.05 ratio. Nasdaq declining issues over advancing issues came in
at 1.25, and down-volume beat up-volume by a 3.38 ratio.
The Dow Jones Industrial Average
(
$INDU.X |
Quote |
Chart |
News |
PowerRating) closed down 0.08% at 8663.50. The S&P 500
(
$SPX.X |
Quote |
Chart |
News |
PowerRating)
closed down 0.18% at 916.08. The
Nasdaq
(
$COMPQ |
Quote |
Chart |
News |
PowerRating) closed down 1.55% at 1315.06.

1,565
1,389
Declining Issues
1,135
1,735
464,430,830
218,104,897
485,506,880
736,490,909
Total
Volume
966,501,420
974,518,110
Highs
24
24
21
64
Top sectors:
Forest and Paper Index
(
$FPP.X |
Quote |
Chart |
News |
PowerRating), up 1.46% at 305.82.
DeutscheBank Energy Index
(
$DXE.X |
Quote |
Chart |
News |
PowerRating), up 1.27 at 361.79.
Losing sectors:
Biotechnology Index
(
$BTK.X |
Quote |
Chart |
News |
PowerRating), down 4.21% at 346.38.
Computer Hardware Index
(
$HWI.X |
Quote |
Chart |
News |
PowerRating), down
3.41% at 99.70.
Sectors with Most New 52-Week Highs (10 or more):
None.
Watch List Action:
Apollo Group
(
APOL |
Quote |
Chart |
News |
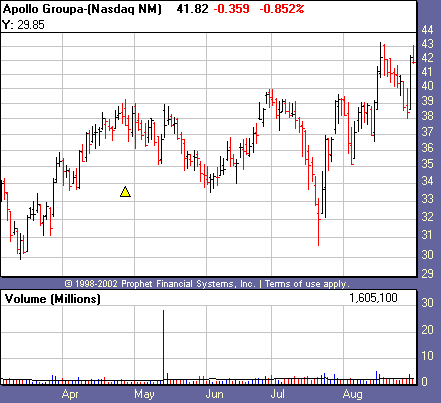
PowerRating) has bounced back from a test of its base, though turned
away from a new 52-week high for the day. Thursday’s heavy accumulation is a
positive.

Corinthian Colleges
(
COCO |
Quote |
Chart |
News |
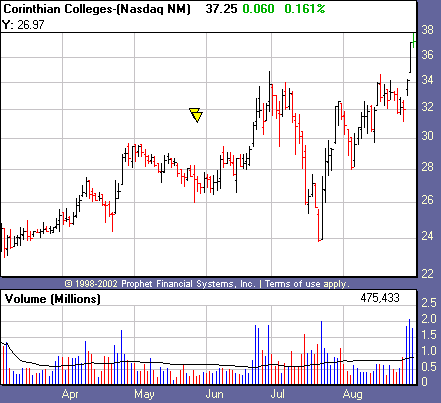
PowerRating) is our latest breakout and is looking strong as it hit a
new 52-week high Friday and is backed by heavy accumulation for the
week. This provider of higher education has earnings of 35% and 67% for the last
two quarters, respectively, and carries a strong individual, as well as group RS
number. Let’s hope this one can last.

Recent Breakouts
size=2>We monitor the action of Recent Breakouts as an indicator of
the market health for IT traders. When breakouts are acting well, this is a good
sign for the likelihood of further sustainable breakouts. When breakouts are
failing, IT traders should be even more cautious.
| color=#ffffff size=2>Company Name | color=#ffffff size=2>Symbol | color=#ffffff size=2>12 Month RS | color=#ffffff size=2>Price | color=#ffffff size=2>Price Change | color=#ffffff size=2>Average Volume | Pivot | 52-Week High |
Apollo Group | ( APOL | Quote | Chart | News | PowerRating) | 95 | 41.83 | – 0.35 | 2,471,300 | 39.60 | 43.27 |
Corinthian Colleges | ( COCO | Quote | Chart | News | PowerRating) | 98 | 32.75 | + 0.06 | 465,400 | 34.69 | 38.00 |
Stocks Forming a Handle
| color=#ffffff size=2>Company Name | color=#ffffff size=2>Symbol | color=#ffffff size=2>12 Month RS | color=#ffffff size=2>Price | color=#ffffff size=2>Price Change | color=#ffffff size=2>Average Volume | Pivot |
Coach Inc. | ( COH | Quote | Chart | News | PowerRating) | 89 | 24.63 | -0.83 | 1,139,500 | 28.35 |
International Game Technology | ( IGT | Quote | Chart | News | PowerRating) | 77 | 64.68 | -0.70 | 965,800 | 66.70 |
Kohl’s Corporation | ( KSS | Quote | Chart | News | PowerRating) | 70 | 69.72 | +0.83 | 2,516,700 | 73.75 |
Mid Atlantic Medical Services | ( MME | Quote | Chart | News | PowerRating) | 94 | 36.11 | +0.19 | 708,300 | 37.87 |
Penn National Gaming | ( PENN | Quote | Chart | News | PowerRating) | 93 | 18.30 | +0.13 | 333,000 | 20.12 |
Alliant Techsystems | ( ATK | Quote | Chart | News | PowerRating) | 85 | 68.22 | +0.47 | 279,500 | 69.95 |
NVR Inc. | ( NVR | Quote | Chart | News | PowerRating) | 92 | 296.50 | -1.50 | 134,900 | 324.60 |
We are eliminating NVR Inc.
(
NVR |
Quote |
Chart |
News |
PowerRating) form the
list as it has crossed below its 50-day moving average and has broken down from
its tight handle formation.
Stocks Building A Base
color=#ffffff size=2>Company Name | color=#ffffff size=2>Symbol | color=#ffffff size=2>12 Month RS | color=#ffffff size=2>Price | color=#ffffff size=2>Price Change | color=#ffffff size=2>Average Volume |
Hovnanian Enterprises | ( HOV | Quote | Chart | News | PowerRating) | 96 | 31.12 | +0.59 | 457,300 |
Wellpoint Health Network | ( WLP | Quote | Chart | News | PowerRating) | 88 | 74.37 | +1.06 | 1,882,100 |
href=”mailto:danielb@tradingmarkets.com”>danielb@tradingmarkets.com
If you are new to the “IT” strategy, be sure to
take a look at our
intermediate-term online trading course.
Intermediate-Term Traders
Report is posted on
Tuesdays and Fridays. For other intermediate-term commentary, be sure to read
Mark Boucher (Fridays),
Tim Truebenbach (Tuesdays and Thursdays), and
Gary Kaltbaum (Mondays and Thursdays).
