What Breadth Suggests About The Magnitude Of The Current Rally
This past week, the major averages
continued to try to break through resistance
levels, though not all averages have yet cleared resistance hurdles.
The Naz continued its mini-bull move to new 52-week highs, while the S&P is
still approaching its 52-week high. Technicals and fundamentals are looking more
positive, as we have been suggesting they would on this move for more than six
months, but breadth indications remain consistent with a mini-bull move — and
not a multi-year bull market of the type investors witnessed in the ’80s and
‘90s.Â
Leading sectors from the past week included homebuilders, biotech, internet,
communications, software and banks. We also like gold, base metals, Emerging
Markets, and commodity indexes long-term. The weakest industries are autos
(especially European), chemicals, selected household products, selected
industrial machinery, food and selected retail — although no groups are making
new lows in our Bottom RS/EPS New Lows lists in breadth that we would like to
see for good shorting opportunities except against stronger groups.
The dollar has weakened sharply this year and this is helping to reflate the US
economy, though mostly at the expense of Europe. The weakening dollar hasn’t
affected the Asian markets much because the Chinese yuan is pegged to the dollar
as are many Asian currencies (both directly and indirectly) and Japan has used
central bank intervention to mitigate the strength of the yen versus the dollar
caused by their chronic current account surplus. The ECB finally cut rates by
50 bps, which may put a temporary top on the Euro since the Euro is overdone in
the short-run against the dollar. The trade-weighted euro has appreciated by
15% in the last year, so the ECB is expected to cut rates several more times in
order to save European economies from outright deflation (expect another 50 bp
cut in September?).Â
The U.S. bond market is in a broad topping pattern, and is as overvalued and
overbought as it has been since WWII. Investors should beware that if the US and
global economy recovers from reflation efforts as we expect, the bond market is
in a bubble that could lead to a 1994-type steep decline sometime over the next
year or so as the economy gains traction and inflationary pressures emerge. Yet
in the short-run the downside is limited until it is blatantly clear that
reflation is working. The combination of positive though not outstanding
breadth, similar technicals, and reflation lead us to continue to expect that
the strongest rally since the 2000 peak is underway and that the market is
likely to rally until it is clear that the economy is gaining steam. Yet
long-term the market remains extremely overvalued and no mania bubble market has
yet escaped a decade-long sideways correction once it reaches bottom.Â
Therefore, we are positive on the market in the intermediate term, but extremely
cautious on the market in the long term and would not be surprised to see a
retest of these lows in the years ahead after the current rally yields to
decline either due to inflationary pressures or a weaker than expected economy
that cannot gain permanent traction. Â
Investors should continue to add stock exposure as trade signals are generated.
A high volume, strong breakout of the major indices to new 52-week highs will
turn us more aggressively bullish. All of the conditions are in place for a
stock market rally; now we await market follow through and breakouts of stock
that meet our strict criteria.Â
As we mentioned in
last week’s article, we are now listing stocks that meet our criteria and
ones that are close calls from now on and let those following our work determine
the exact entry and exits of those methodologies. Investors wanting more
specific use of this methodology can invest in one of the funds that follows
these and many of our other models and/or subscribe to our monthly, Portfolio
Strategy Letter (Email
Rob@investmentresearchassociates.com).Â
Our model portfolio followed in TradingMarkets.com with specific entry/exit/ops
levels from 1999 through May of 2003 was up 41% in 1999, 82% in 2000, 16.5% in
2001, 7.58% in 2002, and is up around 6.4% YTD on a worst drawdown of under 7%.Â
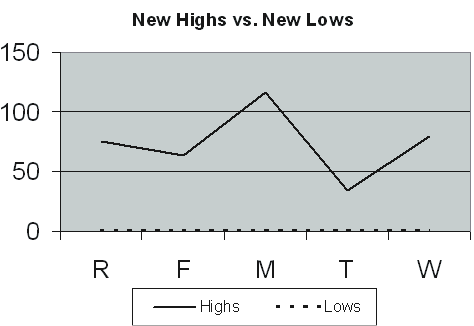
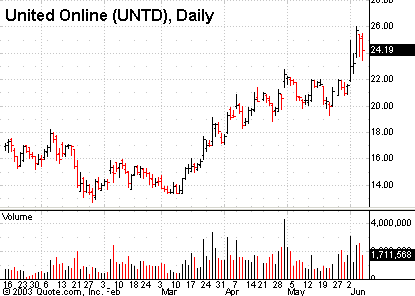
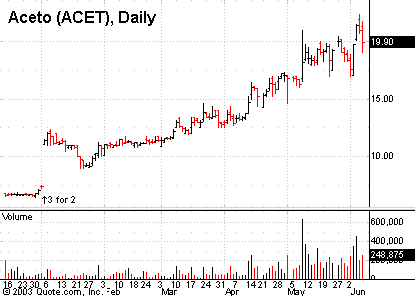
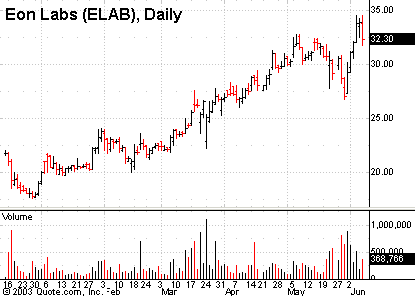
Last week in our Top RS/EPS New Highs list published on TradingMarkets.com, we
had readings of 75, 63,116, 35, and 80 in our Top RS/EPS New Highs list,
accompanied by 8 breakouts of 4+ week ranges, one valid trade with
United Online
(
UNTD |
Quote |
Chart |
News |
PowerRating) and close calls with
Aceto
(
ACET |
Quote |
Chart |
News |
PowerRating),
Eon Labs
(
ELAB |
Quote |
Chart |
News |
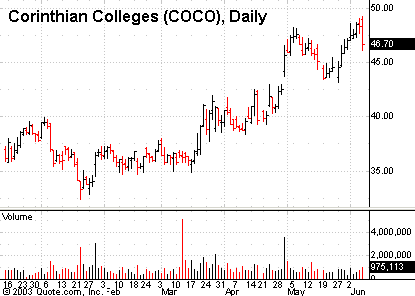
PowerRating) and Corinthian Colleges
(
COCO |
Quote |
Chart |
News |
PowerRating). While breadth has improved some, there is still a lack of quality
breakouts. On a real bull move we would see hundreds of breakouts in close calls
or stocks meeting our criteria, not just eight.
Remember to try and position in valid 4 week trading range breakouts on stocks
meeting our criteria or in close calls that are in clearly leading industries,
in a diversified fashion. Bottom RS/EPS New Lows remained non-existent last
week, as they have been since mid-April, showing low readings of 1, 1, 1, 1, and
1, 1 breakdown of a 4+ week pattern and NO close calls, so the short-side
remains muted.Â
Continue to watch our NH
list and buy flags or cup-and-handle breakouts in NH’s meeting our up-fuel
criteria that are in leading groups.
For those not familiar with our long/short strategies, we suggest you review my
book
The Hedge Fund Edge, my course “The
Science of Trading,”
my video seminar, where I discuss many
new techniques, and my latest educational product, and
interactive training module. Basically,
we have rigorous criteria for potential long stocks that we call “up-fuel,” as
well as rigorous criteria for potential short stocks that we call “down-fuel.”
Each day we review the list of new highs on our “Top RS and EPS New High List”
published on TradingMarkets.com for breakouts of four-week or longer flags, or
of valid cup-and-handles of more than four weeks. Buy trades are taken only on
valid breakouts of stocks that also meet our up-fuel criteria.
Shorts are similarly taken only in stocks meeting our down-fuel criteria that
have valid breakdowns of four-plus-week flags or cup and handles on the
downside. In the U.S. market, continue to only buy or short stocks in leading or
lagging industries according to our group and sub-group new high and low lists.
We continue to buy new long signals and sell short new short signals until our
portfolio is 100% long and 100% short (less aggressive investors stop at 50%
long and 50% short). In early March of 2000, we took half-profits on nearly all
positions and lightened up considerably as a sea of change in the
new-economy/old-economy theme appeared to be upon us. We’ve been effectively
defensive ever since.
For more than six months, we’ve been talking about this rally being a mini-bull
move that will be the best one investors have seen since 2000. So far, breadth
and technicals are confirming this. Investors should remember to wait for valid
breakouts of stocks meeting or close to our rigid criteria. By positioning in
these stocks, you should be able to continue to substantially beat the moves of
the averages, even though most trades come after the move is well on its way.
We continue to watch for clear leadership in leading new industries and
plurality of breakouts in those industries, for follow-through by close call and
criteria stocks, for breakouts by the averages that will confirm if this
bear-market rally has legs, and for further breadth thrusts, to tell us that a
better bullish cycle is developing here. Better times seem to be materializing
here with the weakened dollar, low interest rates, increasing sentiment, and
tax-cut stimulation. Now corporate profits and capital investment must come
through by meeting and exceeding expectations.Â
Until next week,
Mark Boucher
