What Do Paris And Milan Have In Common With Wall Street?
Fickleness. Just like last year’s fashion
styles are so "last year," the market continues to change its mind on
the trading style that is "en vogue" on a day-to-day basis. While this
makes every morning somewhat exciting and mysterious, it gets a bit annoying.
Luckily yesterday’s price action was a dream. It was a page, no not a page, a
full feature, from the late-July/August 2002 Trading Fashions catalog.
As I had mentioned in yesterday’s column, the market was prepared for a move
higher based on technical as well as sentiment indicators. Well, we got the
move, and it was a vicious one. It did not change anything from a long-term
perspective, but it certainly made trading very enjoyable and profitable in the
morning.
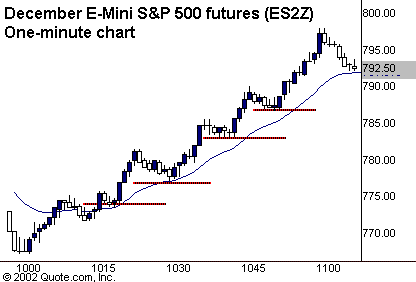
Take a look at the chart of the one-minute S&Ps from yesterday morning
below:

Each red line represents an
eligible pullback that would have allowed you to buy the S&Ps, or as I do,
the underlying stocks. Each move off these consolidation levels (red lines) was
worth at least 6 S&P points, more than enough room to get in and out of
trades, then re-establish another one before the next leg up. For me, I took all
four of these setups, and with conviction.
That being said, go back and look at a one-minute chart from 10:15 to 11:00
AM EST yesterday on the following stocks. If you were not in these stocks on
each of the pullbacks noted above in the S&Ps, you were not paying
attention. Yesterday was one of those sessions where the market offered the
nimble trader some great trades.
Citibank
(
C |
Quote |
Chart |
News |
PowerRating)
Home Depot
(
HD |
Quote |
Chart |
News |
PowerRating)
Wal-Mart
(
WMT |
Quote |
Chart |
News |
PowerRating)
IBM
(
IBM |
Quote |
Chart |
News |
PowerRating)
Microsoft
(
MSFT |
Quote |
Chart |
News |
PowerRating)
Amgen
(
AMGN |
Quote |
Chart |
News |
PowerRating)

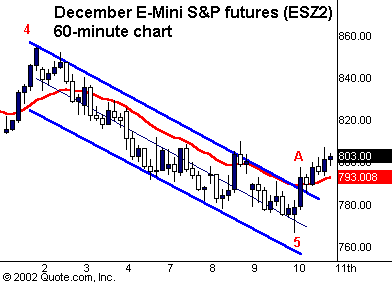
In yesterday’s column I had
mentioned that there were some technical reasons that indicated that in the
short run, the market may have been in the process of putting in a bottom. The
key was noticing that a Wave 5 was nearing completion, the trigger was simply a
break of the regression channel (A). Will the trend continue? For now, it
appears as though it will, but there are still some critical resistance levels
to overcome first.
Please pay careful attention to the charts below. While the market may be
trading somewhat erratically presently, the one thing it is doing is trading
very technically. You can bet that just about every reversal, major or minor in
the major indices, specifically the S&Ps, is based on some technical level.
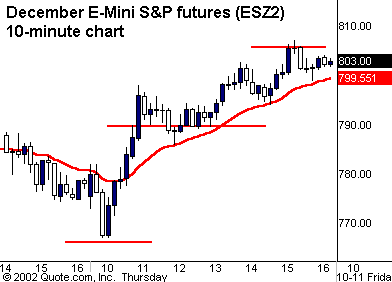
Look back to yesterday’s turning points:
KTNs From Thursday’s Column:
S&Ps: 806 790 766
Now look at the chart below:

The lines in red are the
KTNs that were mentioned in Thursday’s column. Knowing these and factoring them
into your trading plan makes navigating this market far less frustrating.
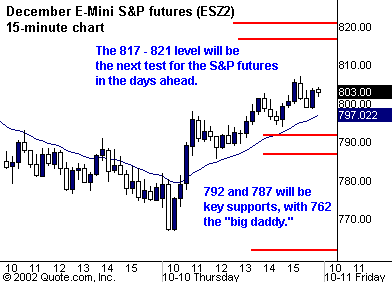
So with that in mind, make some notes on the chart
below. These levels will likely play a role in today’s trading.

As of 5:30 AM PST the futures are poised for a higher
opening. However, the release of Michigan
Consumer Sentiment at 6:45 AM PST may offer up
a nice volatility spike if it comes in far away from expectations. The consensus
is for a reading of 86.
Key Technical
Numbers (futures):
S&Ps |
Nasdaq |
| *842-43* | *900-05* |
| 830 | 882 |
| 821 | 870 |
| 817 | *850-55* |
| 800-06 | 840 |
| 792 | 832 |
| 780 | 815 |
| 766 |
* indicates a level that is more significant.
As always, feel free to send me your comments and
questions. See you in TradersWire.
