What do you think investor risk/reward is?
The mid-term election mystery move advances and the shorts
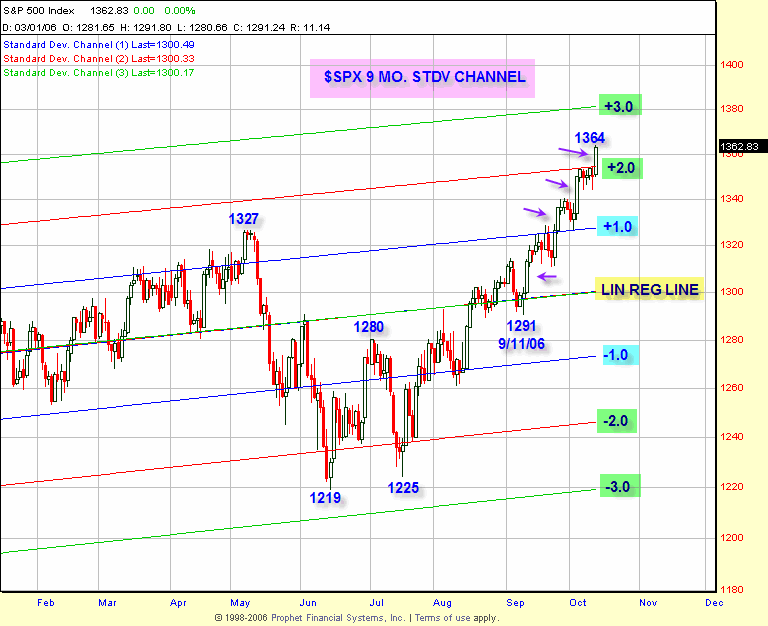
continue to get run-in, as the SPX is +2.7% above the 1327 May high and .707
retracement to the 1553 3/24/2000 top. Like magic, the SPX popped 13
points yesterday to a 1362.77 close (+0.9%) on the same day that the President
is all over the airwaves on the North Korea, the economy and deficit reduction.
Starting with the September low of 1290 (1300 close) the SPX has gained 54
points in just 4 trading days from that 1300 close. The rest of the action
goes sideways until the next explosive day from nowhere, which is made easy due
to the lack of supply.
NYSE volume was on the light side yesterday at 1.56 billion
shares, relative to the SPX +0.9% day, but that is more a function of lack of
sellers. The internals were one-sided with the volume ratio 83 and breadth
+1934. That has been the case on each of the 4 days that the SPX has
gained a total of about about 54 points, which is almost all of the 63 total
points gained from that September 11th low. The sectors were all up
yesterday, led by energy and gold. The OIH was +2.6% and the $HUI was
+2.5%. They were followed by the $XBD and SMH, each +1.8%.
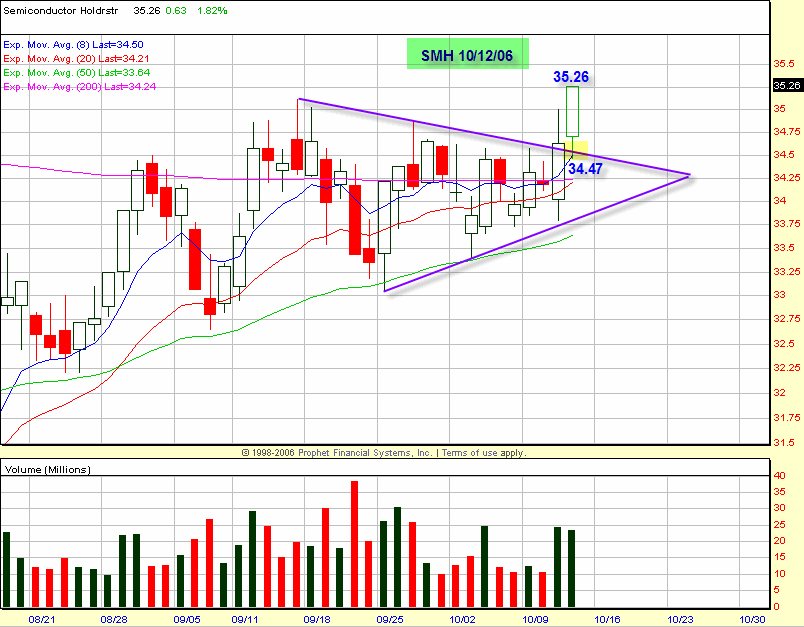
Semiconductors have been a current trading focus in the trading service because
of the contracted volatility patterns in the SMH and INTC, at their 200-233 DEMA
and an obvious target for the hedge funds to accelerate any institutional buying
in this sector group. Both the SMH and INTC traded above their pattern
ranges yesterday. The trading service focus has been
(
SMH |
Quote |
Chart |
News |
PowerRating),
(
INTC |
Quote |
Chart |
News |
PowerRating),
(
TXN |
Quote |
Chart |
News |
PowerRating),
(
KLAC |
Quote |
Chart |
News |
PowerRating),
(
NVLS |
Quote |
Chart |
News |
PowerRating) and
(
AMD |
Quote |
Chart |
News |
PowerRating).
Volatility reverts to the mean, and you have just seen it with
crude oil and gold declining from extended levels despite the hype to the
contrary. The same is true for the SPX from the +2.0 standard deviation
band in May at 1327 down to the 1220-1225 key price zone and -2.0 standard
deviation band. Here we go again, and the SPX is extended beyond the
9-month +2.0 standard deviation band. You get the drift. The +3.0
band is just below the 1385 .786 retracement to 1553. What do you think the
investors’ risk/reward is? Correct. Zip. It remains a trader’s
market and the strategies from the trading modules repeat on a daily basis,
especially when you use the ATL and BTL stock selection method. Check out
these strategies and more in
Trading With The Generals 2004,
Sequence Trading Module, and
First Hour Reversals Trading Module.
Have a good trading day.


