What happened to Nasdaq trading?
On the surface of it, NASDAQ trading–and trading the tech stocks
specifically–is the best it’s been in years. We’re seeing new bull market
highs in the major NASDAQ averages and such stalwarts as
(
AAPL |
Quote |
Chart |
News |
PowerRating) and
(
GOOG |
Quote |
Chart |
News |
PowerRating) are
pacing the market. Yet not all is well in NAZ trading land.
Volatility–that index quality most prized by short-term traders–has been
leaving that market at an alarming pace. We all know that volatility is
down in the S&P 500 and that the VIX has been trading at or near multi-year
lows. Less acknowledged is that the NASDAQ 100 Index has been losing
volatility relative to even the S&P 500.
I owe this interesting observation to Paulo de León, an observant reader of
my new market analysis blog.
Perhaps it takes a market observer from Guatemala to see what has been under the
noses of American traders for a while: the NAZ is not the trading index it used
to be. Perhaps this is a function of traders simply voting with their
feet. A look at my database finds that 100 day average volume in the SPY
exchange traded fund has increased by about 41% since January, 2003. The
corresponding volume in the
(
QQQQ |
Quote |
Chart |
News |
PowerRating) ETF is up only about 2%. Overall NYSE
volume has risen about 18% since January, 2003; NASDAQ volume is up only 5%.
But, as Mr. de León notes, it’s in the area of volatility that we can truly
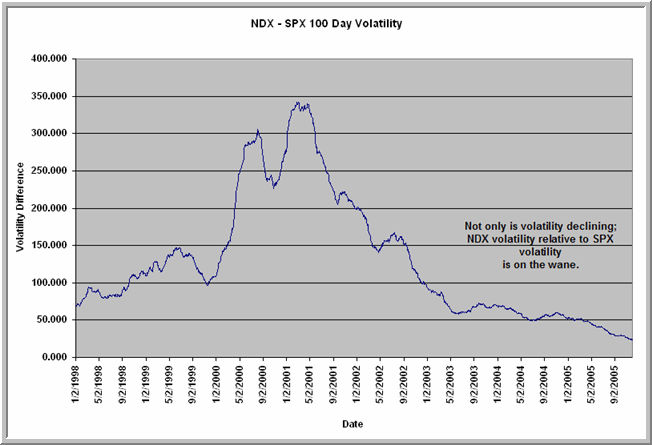
see the recent shortcomings of the NAZ. Below, I charted a 100-day moving
average of the volatility of the NASDAQ 100 cash index minus the volatility of
the S&P 500 cash index. I computed volatility by summing the
individual trading ranges for each day. What we can see clearly is that
the difference between NDX and SPX volatility has been steadily declining.
It is at its lowest levels since the mid 1990s–and the lowest level since
January, 1998.

In his missive, Mr. de León asks why NDX could lose so much of its
volatility given its composition. To answer that question, we turn to
research from my Cornell University, my old stomping grounds in Ithaca,
NY. Charles M.C. Lee and Bhaskaran Swaminathan published an
article in the Journal of Finance (October, 2000) that found an interesting
pattern in stock trading. Over relatively short time frames (measured in
months), high volume rising stocks tend to outperform the general market.
Over a longer time frame of up to five years, however, those high volume rising
stocks tend to underperform the broad market. The authors observe
that, with time, high volume winners tend to become high volume losers and then
settle into patterns of being low volume losers. Only later might they
return to their winning ways, initially on low volume.
Lee and Swaminathan refer to this process as the Momentum Life Cycle (MLC).
They hypothesize that there is a normal developmental process among stocks in
which low volume winners become noticed by investors and become high volume
winners. At this high volume, winning stage, the stocks are ideal trading
vehicles but less attractive as long-term investments. This is because the
high volume winners are unusually vulnerable to negative earnings surprises,
which rapidly transform them into high volume losers. Such an event
disheartens investors and leads to a decline in volume, which in turn
discourages traders.
The MLC explains much of the boom and bust we’ve seen in past markets, such
as gold and Japanese equities, and it could well explain the decline of the NDX
as a trading vehicle. This is not to say the NDX–or its components–are
not tradable; it simply means that the best days of its life cycle may be behind
it.
The implications for the current market are profound. If the MLC
hypothesis holds, high volume winning stocks–
(
GOOG |
Quote |
Chart |
News |
PowerRating) comes most immediately to
mind–are today’s trading favorites, but may not be the best investments for the
next several years. Yesterday’s favorites–those tech stalwarts–are also
not likely to be tomorrow’s shining investments or exciting daytrading
vehicles. Those, Lee and Swaminathan suggest, are probably found among
today’s less heralded low volume winners. My next article will take a look
at those.
Brett N. Steenbarger, Ph.D. is Associate Clinical
Professor of Psychiatry and Behavioral Sciences at SUNY Upstate Medical
University in Syracuse, NY and author of The
Psychology of Trading (Wiley, 2003). As Director of Trader Development
for Kingstree Trading, LLC in Chicago, he has mentored numerous professional
traders and coordinated a training program for traders. An active trader of the
stock indexes, Brett utilizes statistically-based pattern recognition for
intraday trading. Brett does not offer commercial services to traders, but
maintains an archive of articles and a trading blog at www.brettsteenbarger.com
and a blog of market analytics at www.traderfeed.blogspot.com.
He is currently writing a book on the topics of trader development and the
enhancement of trader performance.
