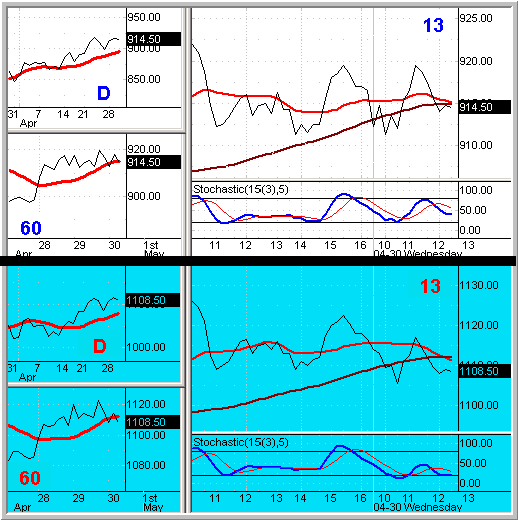
What Might Trigger The Downside
Both major markets are testing
critical hourly supports as we head to midday, with
Tuesday’s 920-923 zone continuing to provide S&P resistance to the north.
Continuing our theme this week of using line charts reflecting period closes,
there is some longer-term market topping potential given price vs.
momentum divergences, a weaker Nasdaq and a failure of ES to close above 920
both yesterday and today, yet a clean break of the hourly trend and preferably
aided by a break of an hourly trend line (south of 910) that goes back to March 10 is likely
necessary to get the downside going for anything more than an intraday trade.
I’ve gotten quite a bit of mail this week inquiring into Monday’s reference to
“Three Price Break” and will do a brief overview on it in a future column. The
topic will also be covered during our upcoming
Virtual Pit event, as will advanced trading issues including use of the TICK
and other issues. Yet my belief in keeping trading as simple as possible remains
the underlying theme, as we let the market do the heavy lifting amidst a series
of common and constant indicators.
ES (S&P)
Wednesday April
30, 2003 12:00 PM ET
NQ
(Nasdaq)

Moving Avg Legend:
15MA 60-Min 15MA
See
School and
Video for Setups and Methodologies
Charts ©
2002 Quote LLC
Good Trading!
P.S. Spend a week with me trading the E-minis —
Live! Click
here for details.
