What The Current Bollinger Band Action Could Lead To
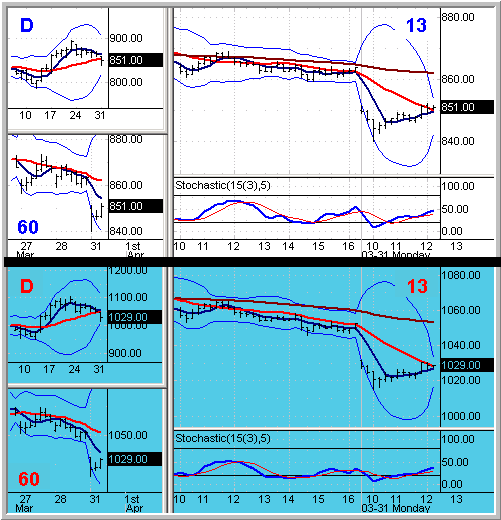
Both major markets are testing
their respective daily support zones as we approach midday, having rebounded off
early lows. Early morning bounces via
course triggers off the post-PMI retail fleecing provided decent early
opportunity, in addition to early short entries on pullbacks in the early
three-minute downtrend. Bollinger bands are tightening on the 13 as we go to
press, which could lead to some midday consolidation as we await afternoon
setups.
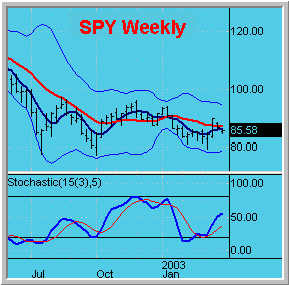
The current significant timing conflict at play can be seen in the longer-term
charts, as the weekly trend remains down despite the euphoric turns in the
hourly and daily over the past few weeks. I’ve posted the weekly SPY chart
below, which upon review provides no great mystery as to why we’ve had the
recent daily swings. The daily and weekly have been playing ping-pong off their
respective trend supports, similar to what we often see intraday on the 13 and
60-minute charts.
ES (S&P)Â Â Â Â Â
Monday March 31, 2003 12:10 PM ET       NQ
(Nasdaq)

Moving Avg Legend:
5MA
15MA 60-Min 15MA
See
School and
Video for Setups and Methodologies
Charts ©
2002 Quote LLC

Good Trading!
Â
Â
