What The VIX Is Telling Us
The major markets are hovering
around CRITICAL
daily levels as we go to press, with
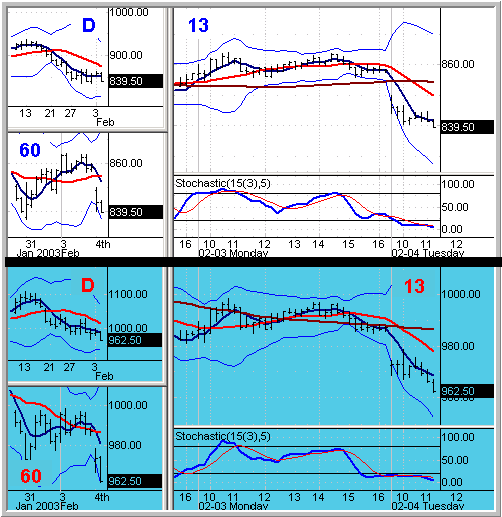
tests of the 840 and 970 levels on the S&P and Nasdaq, respectively. Yesterday
afternoon’s ES break of 13 minute support (the third attempt at a 13-minute
reversal over the last few days) was enough to trigger a continuation of the
daily downtrend and is a good example to reinforce the importance of considering
second and third entries and the increased probability associated with each
subsequent attempt. This is an area where many traders give up and this concept,
if mastered successfully, can result in more Ps in the trader’s P&L as we
discuss in
the video. A clear break of these supports could provide fuel for a stronger
downdraft.
Many of you know there are a few times each year that I pay attention to the
VIX.X. Normally, I could care less in the interest of stressing simplicity over
complexity, yet in extreme markets I certainly value the guidance on the daily
chart. How can one attempt to interpret it? The same way we do our price charts
— by keeping all chart attributes constant including using a 15MA as trend
support.Â
So what did the daily
(
$VIX.X |
Quote |
Chart |
News |
PowerRating) chart tell us
at close yesterday? As noted below, the VIX.X closed in a strong pullback to a
sharply uptrending support. Combine such a signal with the daily ES chart which
was approaching a downtrend support, and it can help gauge the probability of a
further daily down move and a corresponding bounce in the VIX.X.
ES (S&P)Â Â Â Â Â
Tuesday February 4, 2003 11:00 AM ET       NQ
(Nasdaq)

Moving Avg Legend:
5MA
15MA 60-Min 15MA
See
School and
Video for Setups and Methodologies
Charts ©
2002 Quote LLC

Good Trading!
Â
