What this market needs to signal a green light
In
our recent article, Henry Carstens and I pointed out
that discretionary traders can benefit from trading signals derived from
backtested trading systems. The idea is to
supplement your existing setups (which hopefully provide you with an edge) with
an additional, uncorrelated source of edge. When there is a green light from
the trading system, as there was at Tuesday’s close, and you also get a valid
setup for a long position from your own analysis, you’ve placed the odds
strongly in your favor.
Well, we got the green light, but not the trading
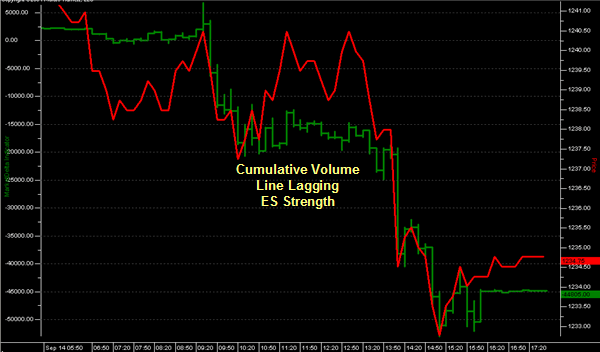
setup on Wednesday. Check out the chart below, from
Market Delta. It’s a bit hard to read,
but you can see that the green line is in a steady downtrend through the day,
even as the red line (ES price) is locked in a midday range. The green line is
a cumulative running total of the number of ES contracts trading at the offer
minus the number trading at the bid. The tepid midday performance of the green
line, even as the ES bounced higher, suggested that large players were not
lifting offers during the move. Equally concerning was the fact that the market
was stalling at its previous day’s volume weighted average price (VWAP), which I
post daily on my site. You don’t
need to be a genius to figure out that a market that cannot trade above its
average price and is not attracting net buying participation is not ready for
its green light.

Look at it this way: If I’m playing
Texas Hold’em and draw an Ace, King suited against two other opponents, I’ll
take a look at the flop. Even if one of the other players has, say, two eights,
I still have a 42% probability of winning the hand. If, however, the flop turns
up a five, seven, and three, now my odds of winning when my opponent has a pair
go down to 25%. I might want to muck the hand at that point. Although I had
odds in my favor going into the flop, those odds changed for the worse as the
hand progressed. That’s what happened in Wednesday’s trade, and–following
discipline–I mucked the trade idea.
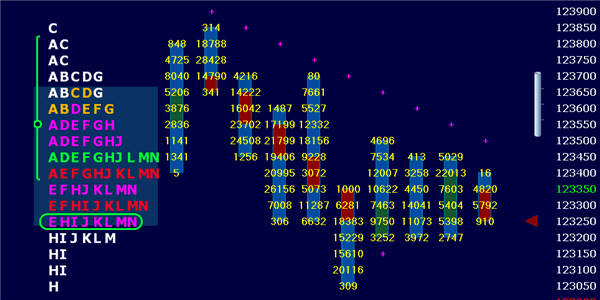
Now here’s an update from Thursday’s
market, using a chart drawn from the
WINdoTRADEr program. Notice, on the 45 minute candles, how we stayed
beneath the trend line, accepted price through the day at lower levels,
and–despite the "tail" signifying a rejection of the 1230.50 level on the
continuous contract–remained in the lower half of the day’s distribution for
the balance of the session. Observant traders also noted that significant
volume at 1234 in the next to last bar could not move us higher, creating an
important resistance zone for reference on Friday. If Wednesday provided bad
cards for a long position on the flop, Thursday did no better at the turn.

The green light is no longer is in
force, so it’s back to the system drawing board. Once again we see that a large
part of successful trading, like poker playing, is keeping one’s ammunition dry
and then knowing when to make the aggressive bets. Let’s see the cards we’re
dealt going forward.
Brett N. Steenbarger
Brett N. Steenbarger, Ph.D. is Associate
Clinical Professor of Psychiatry and Behavioral Sciences at SUNY Upstate Medical
University in Syracuse, NY and author of
The Psychology of Trading (Wiley, 2003). As Director of Trader
Development for Kingstree Trading, LLC in Chicago, he has mentored numerous
professional traders and coordinated a training program for traders. An active
trader of the stock indexes, Brett utilizes statistically-based pattern
recognition for intraday trading. Brett does not offer commercial services to
traders, but maintains an archive of articles and a trading blog at
www.brettsteenbarger.com.
Henry Carstens is a proprietary trader in
Portland, Oregon who uses a portfolio of statistically-based automated and
discretionary trading
systems in the markets. His thoughts about system design and automation can be
found at
https://www.verticalsolutions.com.
