What You Should Look For Today
The December S&P 500 and
Dow futures performance this past week was almost a mirror image of
the previous week with underlying tech stocks underperforming while more
defensive-type shares demonstrated good relative strength.
One of the major themes of the
week was the rotation out of growth-orientated shares into sectors perceived as
being “safe.” This rotation came despite further upbeat economic and earnings
results. It’s becoming more and more possible that valuations are starting to
matter again, as shares of AMAT (180 times trailing earnings and 55 times
forward earnings) were sold in an aggressive manner following their statement of
a pick-up in orders. Another drag on the futures and equities markets may have
been fresh multi-year highs in the price of Gold, Silver and the CRB Index,
which are all often a good gauge of future inflation. At the same time though,
the bond market rallied, which is usually not indicative of an economy which is
about to experience inflation any time soon. There were many crosscurrents
during the week, which makes it hard to get a firm grip on what to expect in the
future.
The December S&P 500 futures
closed Friday’s session with a loss of -9.00 points, and erased the week’s gains
to finish with a loss of -1.50 points. The December Dow futures closed the
session with a -72 point loss, and finished out the week with a 17 point loss.
Volume in the ES and YM was estimated at 575,000 and 47,279 contracts
respectively, which was behind Wednesday’s pace and below the daily average. On
a weekly basis, the ES posted a doji and market structure high just under the
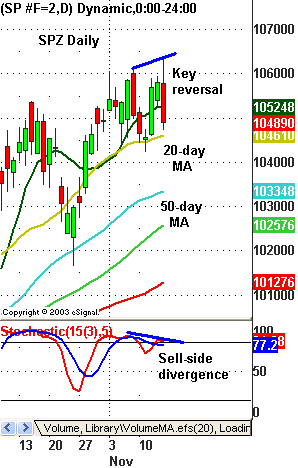
heavy Fib resistance we’ve been tracking. On a daily basis, the ES posted a
market structure high and a key reversal to finish back below its 10-day MA, but
was able to hold its 20-day MA support at 1,046 (see chart). A break of that
support would confirm the double-top with the 11/7 high. On an intraday basis,
the 60-min and 30-min charts both broke head-and-shoulders patterns and with the
extension down from MA resistance, I’ll be looking for retracements on Monday.
The YM also broke back below its 10-day MA, but was able to hold its 20-day MA
support at 9,737.

For the
most part, there really were not any new major developments to report from last
week. Stock index futures have continued to grind into higher ground, however,
rallies have been used as an opportunity to sell into. The S&P 500 made a new
intraday high for the year early Friday, but immediately reversed course and
finished near its low for the session. However, the major indexes still remain
near the top portion of their trading range and little damage has been done thus
far. In fact, the overall technical condition remains a healthy one when using
an intermediate-term time frame.
From a
fundamental standpoint, there was a profit warning and earnings miss from
Wal-Mart mid-week, which seemed to rattle market players. Obviously, when the
world’s largest retailer suggests consumer demand will be less than anticipated,
it has to raise some questions about the future sustainability of the economic
recovery. This is especially true since the one-time tax rebates, which many
suggested were responsible for the consumer spending surge in Q3, seem to have
been exhausted already. At this point, I’m not overly concerned about the
economic recovery completely petering out, but some cracks are definitely
starting to form in the foundation of the continued strong growth thesis.
Looking
ahead this week, there really are not too many large market-moving events on
tap, so it will be very interesting to see how the futures trade on their own.
The economic calendar is highlighted by the Consumer Price Index on Tuesday and
the Philly Fed on Thursday. I’m going to be in Las Vegas at the end of the week
for the Trader’s Expo, so feel free to email me if you’re going to be there.
Daily Pivots for 11-17-03
| Symbol | Pivot | R1 | R2 | R3 | S1 | S2 | S3 |
| COMP | 1946.17 | 1961.88 | 1993.50 | 2009.21 | 1914.55 | 1898.84 | 1867.22 |
| INDU | 9799.81 | 9861.84 | 9954.99 | 10017.02 | 9706.66 | 9644.63 | 9551.48 |
| NDX | 1420.99 | 1434.58 | 1461.65 | 1475.24 | 1393.92 | 1380.33 | 1353.26 |
| SPX | 1054.04 | 1059.96 | 1069.58 | 1075.50 | 1044.42 | 1038.50 | 1028.88 |
| ESZ | 1053.42 | 1059.83 | 1070.67 | 1077.08 | 1042.58 | 1036.17 | 1025.33 |
| SPZ | 1053.17 | 1059.03 | 1069.17 | 1075.03 | 1043.03 | 1037.17 | 1027.03 |
| NDZ | 1422.17 | 1436.33 | 1463.17 | 1477.33 | 1395.33 | 1381.17 | 1354.33 |
| NQZ | 1422.00 | 1436.50 | 1463.50 | 1478.00 | 1395.00 | 1380.50 | 1353.50 |
| YMZ | 9792.00 | 9857.00 | 9958.00 | 10023.00 | 9691.00 | 9626.00 | 9525.00 |
| BKX | 938.55 | 943.41 | 950.78 | 955.64 | 931.18 | 926.32 | 918.95 |
| SOX | 515.38 | 522.67 | 535.37 | 542.66 | 502.68 | 495.39 | 482.69 |
| DIA | 98.34 | 98.94 | 99.91 | 100.51 | 97.37 | 96.77 | 95.80 |
| QQQ | 35.35 | 35.71 | 36.37 | 36.73 | 34.69 | 34.33 | 33.67 |
| SPY | 105.90 | 106.51 | 107.56 | 108.17 | 104.85 | 104.24 | 103.19 |
| SMH | 42.79 | 43.49 | 44.66 | 45.36 | 41.62 | 40.92 | 39.75 |
Fair Value & Program Levels
Fair Value — (0.91)
Buy Premium — 0.26
Sell Discount — (1.61)
Closing Premium – (1.45)
Please feel free to email me with any questions
you might have, and have a great trading day on Monday!
