What’s Up, What’s Down: Lower Crude
Comments for Monday, August 17, 2009
Looking Ahead to Today By Reflecting Back at Friday’s Price Action
ENERGIES:
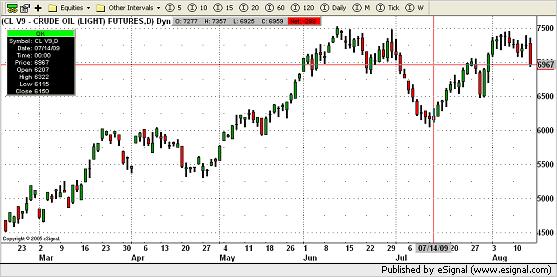
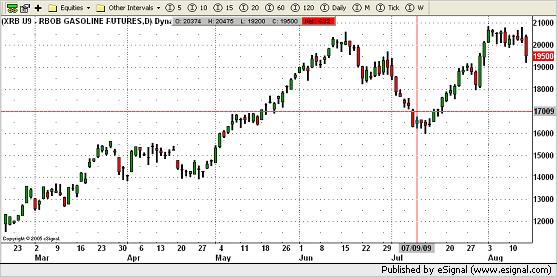
Lower to sharply lower settlements last Friday for crude and heating oil along with the rbob and natural gas. Today’s action gave me sell signals in crude and the rbob while gas continues to struggle making a new contract low and close. Look what one trading session did to the energies that were basically flying high. Heating oil has good support around the 18000 area which should be seen if my sell signals are any good. Buy Signal for Heating Oil; Sell Signal for the RBOB.
GRAINS:
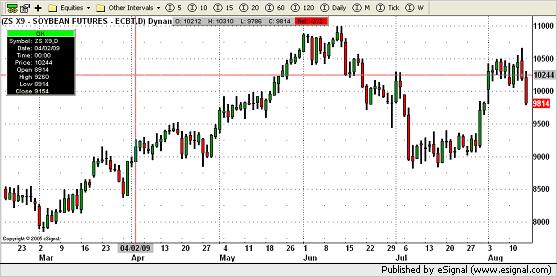
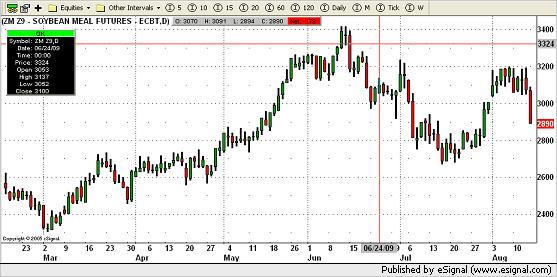
Reports today — Export Inspections, Crop Progress: Higher closes Friday for Chicago wheat, unchanged for rough rice, oats and Kansas City wheat but lower closes for soybeans, soymeal, soyoil, Minneapolis wheat and corn. All of the wheat continue to look weak overall with Minneapolis and KC making new recent lows.making new recent lows and closes this time. Corn settled down near the lows level of its support area but still has held the 220 area since early July and should trade between 300 and 400 dollars basis the December contract through most of the year. There could be a test of 300 to knock out the stops underneath with weather forecasts now calling basically for cooler than normal temperatures also. Oats closed unchanged with strong resistance between 220 and 235 basis the December contract but now forming a potential bottom. Rice also settled unchanged with major support from 130 down to 120 basis the September contract.The beans complex settled lower this time giving me sell signals in the beans and meal with oil still holding in to its buy signal. I am holding Buy Signals for Corn, Beans, Meal and Soyoil; Sell Signals for Rough Rice, Oats & Minneapolis Wheat.
See the balance of my morning comments, including the Metals, Softs, Energies and Grains, at my website. For my complete coverage, visit my commentary page at www.markethead.com.
Rick Alexander has been a broker and analyst in the futures business for over thirty years. He is a Vice-President for Sales and Trading at the Zaner Group (www.zaner.com) a Chicago-based futures brokerage firm. If you would like a free booklet explaining the charts mentioned above, email Rick at ralexander@zaner.com.


