What’s Up, What’s Down: Spotlight on Energies
Comments for August 1, 2011
Looking ahead to Monday by reflecting back on Friday’s trading
Futures and options trading is speculative in nature and involves substantial risk of loss. Futures and options trading is not suitable for all investors
OATS FORMING A BULL TRIANGLE? RICE MAKES ANOTHER CONTRACT HIGH
FUTURES AND OPTIONS TRADING IS SPECULATIVE IN NATURE AND INVOLVES SUBSTANTIAL RISK OF LOSS. FUTURES AND OPTIONS TRADING IS NOT SUITABLE FOR ALL INVESTORS.
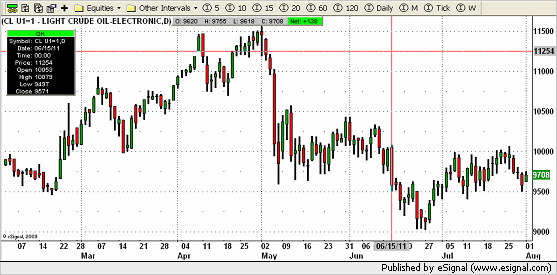
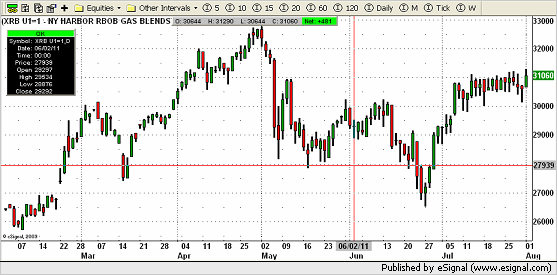
ENERGIES: 8/1/11: Lower closes for crude and heating oil along with the rbob and natural gas. Crude made its lowest low and close in about three weeks with 9500(Sept.) a key price area to watch on the down-side while there is a strong resistance area that goes from 98 to103 in my opinion. Crude feels toppy overall to me but the heat and rbob don’t necessarily agree which makes selling the crude difficult to do at this time and forcing me into a neutral position for the heat. A key price to watch is for the crude is 100(Sept.) to see if it can close over this price even though it won’t give me a buy signal at this time.The heat continues to be at a critical area to get through if its going to turn back higher and also give me a buy signal with 31834(Sept.) a key price to watch. The rbob has been working its way higher overall having resistance around the 320 area and consolidating over its last twelve trading sessions. It’s key price to close over is 31000. Gas, on the other hand, closed lower Seven out of its last eight trading sessions making its worst low and close since July 7th but still in a support area. I’ve removed my buys signal for obvious reasons and probably later than I should have but, if you’re bullish, this is the area to consider to ‘take a shot’ on the long-side since we’ve rallied each time the market has been here. BUY SIGNAL FOR THE RBOB. SELL SIGNAL FOR CRUDE OIL. CALL FOR DETAILS!
In early morning trading the Stock Indices sector is up 1.21% from Friday’s closing prices; with the Russell 2000 and e-mini Dow being the strongest of the five futures contracts which comprise the Stock Indices sector. There are eight futures contracts which comprise the Currency sector; and Currencies is one of eight sectors featured in my Futures HeatMap – a color coded guided to the various market segments strengths and weaknesses. View the HeatMap at https://www.markethead.com/2.0


“A good plan is like a roadmap; it shows the final destination and usually the best way to get there” (H. Stanley Judd). Traders need a trading plan too. Download my TRADING PLAN TEMPLATE by clicking this link or copying and pasting it into your browser:
https://www.zaner.com/3.0/ljstradingplantemplate.asp
Rick Alexander has been a broker and analyst in the futures business for over thirty years. He is a Vice-President for Sales and Trading at the Zaner Group (www.zaner.com) a Chicago-based futures brokerage firm. Email Rick at ralexander@zaner.com or call toll-free (888) 281-4158.
Futures and options trading is speculative in nature and involves substantial risk of loss. Futures and options trading is not suitable for all investors. The information in this Report and the opinions expressed are subject to change without notice. All known news and events have already been factored into the price of the underlying commodities discussed.
