What’s Up, What’s Down: Spotlight on Grains
Comments for April 29, 2011
Looking ahead to Friday by reflecting back on Thursday’s trading
Futures and options trading is speculative in nature and involves substantial risk of loss. Futures and options trading is not suitable for all investors
CHANGE IN SHORT-TERM TREND FOR THE GRAINS?
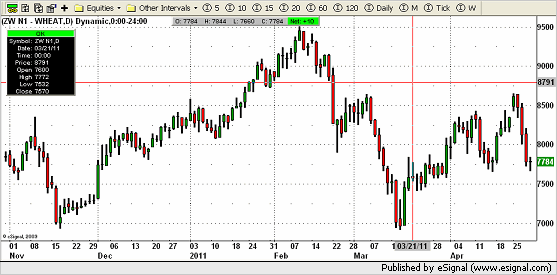
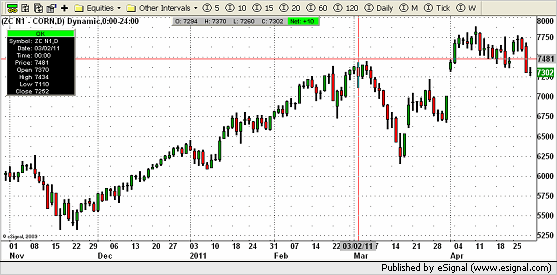
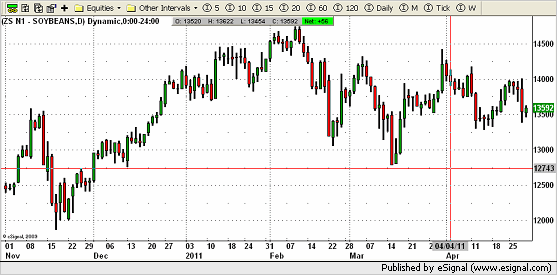
GRAINS: 4/29/11: Lower to sharply lower for corn, rough rice, soybeans, soymeal and soyoil, oats, Minneapolis, Kansas City and Chicago wheat. The sharply lower closes for Minneapolis, KC and Chicago wheat still doesn’t eliminate my buy signals but does signify a possible change in the short-term trend. Key prices to watch in my opinion for the July contracts are Minneapolis(999 & 888), KC(977 & 965) and Chicago(865 & 765). Long with Chicago being in a support area we have new price points to watch for a possible direction. Rice settled lower again but still should be bought on corrections with resistance around the 155(July) area. Oats settled down the expanded 30 cent daily limit making its worst close since the middle of March. Corn also closed down its daily 30 cent limit, filling one gap and part of another finally giving me a SELL SIGNAL. However, the December corn contract did made a key reversal last week(Thursday) and has a gap left down at 625 1/4. Also, the May and July corn contracts still have two gaps below and, in my opinion, fill over 90% of them. The last gap not filled for corn, as far as I can tell, was back in 2009. Please call for details on how to deal with the corn gaps if you are interested. The bean complex also settled sharply lower giving me SELL SIGNAL in the oil to go along with the beans and meal which had their sell signals in place all through their retracement rallies. BUY SIGNALS FOR MINNEAPOLIS, KANSAS CITY AND CHICAGO WHEAT ALONG WITH ROUGH RICE. SELL SIGNALS FOR OATS, CORN SOYBEANS, SOYMEAL AND SOYOIL. CALL FOR DETAILS!
In early morning trading, my Futures HeatMap shows the Grains sector down 0.56% for the day; making it the weakest of the eight groups comprising the Futures HeatMap. Grains are being brought down by weakness in Oats. View the color-coded HeatMap at https://www.markethead.com/2.0


Rick Alexander has been a broker and analyst in the futures business for over thirty years. He is a Vice-President for Sales and Trading at the Zaner Group (www.zaner.com) a Chicago-based futures brokerage firm. Email Rick at ralexander@zaner.com or call toll-free (888) 281-4158.
Futures and options trading is speculative in nature and involves substantial risk of loss. Futures and options trading is not suitable for all investors. The information in this Report and the opinions expressed are subject to change without notice. All known news and events have already been factored into the price of the underlying commodities discussed.
