What’s up with Crude Oil? These 5 charts can tell you
I was prompted to take
an even closer look at the chart of Crude Oil (WTIC) as I actually
went into a gas station (don’t you just love “pay at the pump�) this past
weekend and heard someone make the comment that “gas was as good as gold these
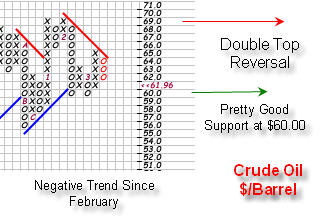
days†to the attendant. Crude actually has seen a decline off of its’ highs
after a double top at around $68.00 per barrel.
Recently, the commodity did drop below its’
50-day simple moving average and 200-day simple moving average. After rallying
back above its’ 200- and 50-day simple moving averages on Friday, the commodity
closed back under those yesterday. In addition, it changed its’ trend to
negative on a point and figure chart back in February and has yet to produce a
new buy signal off of that bottom.

Interesting to note, is that the weekly chart of crude only pulled back to its’
50-week moving average and did not dip below during the time period that it did
dip below its’ 50-day moving average. In other words, the short-term picture for
Crude has deteriorated but the long-term picture still looks bullish. Does this
mean that we can buy oil related stocks still? Or, for commodity traders, go
long crude?
To help make a decision about a certain sector, I often compare sector indexes
to the market as a whole in order to get a gauge on each sectors’ relative
performance. Relative strength analysis can be quite helpful in determining
whether or not the price volatility in a certain entity is indicative of its’
weakening on a relative basis or just a normal pullback. If you are not familiar
with the calculation, it is simply a daily calculation of the value of a market
index minus the value of the sector index divided by the value of a market
index. That number is then plotted and formed into a chart. A rising relative
strength line means the sector is outperforming the market and a falling
relative strength line means the sector is underperforming the market. In order
to gauge the oil sector, I often evaluate the CBOE Oil Index
(
OIX |
Quote |
Chart |
News |
PowerRating) and also
the Philadelphia Exchange Oil Service Index
(
OSX |
Quote |
Chart |
News |
PowerRating) versus the S&P 500 Index
(
SPX |
Quote |
Chart |
News |
PowerRating).
On its’ relative strength chart, OIX began to under perform the S&P 500 in
February and has not showed much movement yet to the upside. However, the
long-term trend is still positive for relative strength.
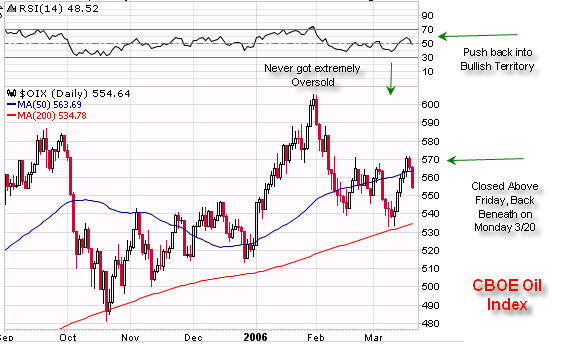
Like Crude Oil, the trend of OIX on a Point and Figure chart is still negative.
It, too, was able to make a move above its’ 50-day simple moving average on
Friday but was not able to hold on to those gains on Monday. Its’ weekly bar
chart remains positive, though.
OSX is in a negative trend on its’ point and figure chart (like the other two)
but it has not been able to close above it’s 50-day simple moving average
(unlike the other two). It, too, began to under perform the broader market in
February even though its’ long- term positive relative strength remains in
place.

On all three of these charts, the Relative Strength Index has just pushed back
above the 50 level. I will also be watching this indicator, which is different
than Relative Strength discussed above. I like to think about it as an
“internal†measure of Relative Strength. It measures the average gain in price
for the index (stock) versus the average loss in price for the index (stock)
over a 14-day period. It is not a comparison of the indexes performance versus
another index, but a comparison of its’ own performance. From November until
February, all three RSIs were firmly trading in the bullish camp. Neither the
RSI for WTIC, OSX, or OIX has gotten oversold (below 30) during this recent
pullback which is an indication of strength for the sector. But, the indicator
has also not been able to go much further than the 50 level since the decline in
prices began in early February. Until the RSI is able to break into the 60
level, I will not be very bullish about the short-term picture of the oil
sector. The RSI is telling me that relative stability is likely in store for the
sector. That may be good for consumers, but it is not good for traders.
The inter-market relationship between commodities and the US Dollar is also
coming into the picture here as the currency closed below its 200-day simple
moving average on Friday after closing above it in February and also spending
some time above its’ 50-day simple moving average as well. It also has had a
trend change to negative on its’ point and figure chart. That is two strikes (at
least) against a rising dollar in my mind, which is conducive to further
strengthening in commodity (oil) prices. However, because Crude Oil was not able
to maintain rising prices on Monday, I view the rise in prices of the commodity
on Friday only as a function of the falling dollar.

There is one more piece to the puzzle that I am going to consider before making
a recommendation and that is the chart of the CRB Index. The index, which is
heavily weighted in crude, still has a negative point and figure chart. It has
also yet to close above its’ 50-day simple moving average. However, its’
short-term relative strength versus the S&P 500 Index remains intact as does
its’ long term, and, the weekly bar chart for the Index is also still positive.
In conclusion, long-term the picture for oil still looks positive even though we
have had recent weakness. The recent weakness will represent a buying
opportunity if the three charts discussed in this column (WTIC, OSX, OIX) can
maintain a position above there 50-day simple moving averages and the negative
trend in the dollar continues. I would also like to see a rise to 60 in the RSI,
but, that is not a necessary in order to “toe-dip†into a new position.
Sara Conway is a
registered representative at a well-known national firm. Her duties
involve managing money for affluent individuals on a discretionary basis.
Currently, she manages about $150 million using various tools of technical
analysis. Mrs. Conway is pursuing her Chartered Market Technician (CMT)
designation and is in the final leg of that pursuit. She uses the Point and
Figure Method as the basis for most of her investment and trading decisions, and
invests based on mostly intermediate and long-term trends. Mrs. Conway
graduated magna cum laude from East Carolina University with a BSBA in finance.