When NOT to buy breakouts
The major indices leapt higher out of
the starting gates Monday morning, but as
we often see in a weak market, stocks rolled over in the afternoon. The broad
market still closed higher, but each of the indices gave back most of their
gains and finished near their intraday lows. Both the S&P 500 and Dow Jones
Industrial Average
(
DJX |
Quote |
Chart |
News |
PowerRating) eked out gains of 0.1%,
while moderate strength in the Networking and Semiconductor sectors helped the
Nasdaq Composite
(
COMP |
Quote |
Chart |
News |
PowerRating) advance 0.6%. The
small-cap Russell 2000 similarly closed 0.4% higher, but the S&P Midcap 400 only
managed a gain of less than 0.1%. At their mid-day highs, both the Nasdaq and
Russell indices were printing 1.7% higher, but the stock market’s afternoon
downtrend erased most of those gains.
Total volume in the NYSE was 6% higher than the previous day’s
level, while volume in the Nasdaq increased by only 1%. Technically, the
market’s broad-based gains on higher volume registered as a bullish
“accumulation day” for both the S&P and Nasdaq, but the intraday action was
rather negative and certainly not indicative of institutional buying. The
positive is that turnover did not increase during the afternoon selloff, but it
didn’t decline either. Volume levels in both exchanges finished the day about
the same percentages higher than where they were when stocks were at their
intraday highs. Again, we expect turnover to remain light throughout the rest of
the month, as the summer doldrums don’t really end until after the Labor Day
holiday.
In healthy markets, buying a breakout to a new 52-week high is
one of the most simple and profitable trading strategies. However, breakouts to
new highs in a weak market have a very high rate of failure. When the breakouts
do fail, they trap the bulls who bought the breakouts, which typically leads to
rapid downward price action. In fact, one of our favorite techniques in a bear
market is short selling stocks and ETFs that break out to new highs, but
immediately fail and fall back down to the bottom of their prior trading ranges.
Momentum accelerates, which usually results in further downward price action and
a break of the primary uptrend lines. The key to all this, of course, is making
sure the breakout has actually failed before attempting to sell short.
Obviously, selling short a stock or ETF that has just broken out to a new high
without first waiting for confirmation of the price failure is suicidal. One
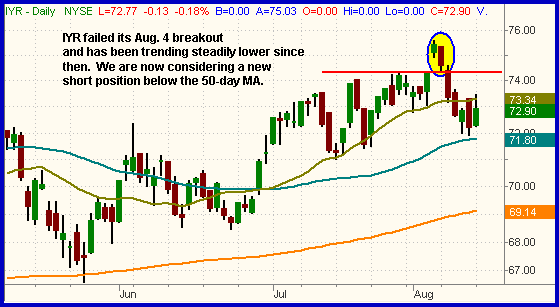
such ETF that meets our criteria for a failed breakout is the iShares DJ Real
Estate Index [IYR|IYR] On
the daily chart below, notice how IYR gapped up and broke out to a new high on
August 4, but promptly fell back into its prior range two days later:

Since failing its breakout, IYR has been consolidating near
the low of its range. If it breaks below the August 11 low, it will also
correspond to a break of its 50-day moving average. That is the point at which
we would consider initiating a new short position in IYR. A logical protective
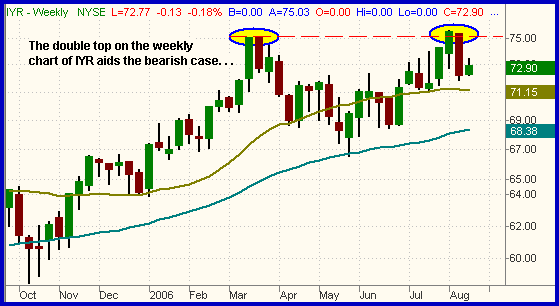
stop price would be 50 cents to 1 point over the 20-day moving average. Taking a
longer-term look at the technical picture of IYR, we also like that a double top
has formed on the weekly chart. Resistance of the prior high from March of 2006
was one of the major reasons this month’s breakout attempt has failed:

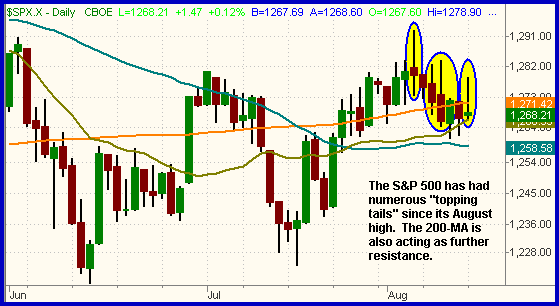
Yesterday’s action caused both the S&P 500 and Nasdaq
Composite to form bearish “inverted hammer” candlestick patterns on their daily
charts. This pattern occurs when an index rallies at some point during the day,
but subsequently sells off and closes near its lowest level of the session. Such
price action tells us there was indecision and a tug-of-war between the bulls
and bears, but the bears took control in the end. Similar bearish formations
have occurred with the S&P 500 on three other days since the beginning of the
month. Notice also how the 200-day moving average once again held the S&P down:

The Nasdaq Composite tested resistance of its primary
downtrend line for the third time within the past two weeks, but once again
failed to break out. Its “inverted hammer” candlestick formed after failing to
overcome the downtrend line:

The bears had the upper hand yesterday, but don’t forget that
the broad market remains choppy and range-bound in the short-term. As long as
the major indices remain below their respective downtrend lines, the overall
odds favor the short side of the market. However, we are laying low and focusing
on managing existing positions rather than entering new ones. As mentioned in
yesterday’s newsletter, this is a good time to develop your plan of attack and
watchlist for both sides of the market so that you are prepared when traders
return back to business in a few weeks.
Open ETF positions:
Long PPH and SDS, short IWM (regular subscribers to
The Wagner Daily
receive detailed stop and target prices on open positions and detailed setup
information on new ETF trade entry prices. Intraday e-mail alerts are also sent
as needed.)
Deron Wagner is the head trader of Morpheus Capital Hedge Fund and founder of
Morpheus Trading Group (morpheustrading.com),
which he launched in 2001. Wagner appears on his best-selling video, Sector
Trading Strategies (Marketplace Books, June 2002), and is co-author of both The
Long-Term Day Trader (Career Press, April 2000) and The After-Hours Trader
(McGraw Hill, August 2000). Past television appearances include CNBC, ABC, and
Yahoo! FinanceVision. He is also a frequent guest speaker at various trading and
financial conferences around the world. For a free trial to the full version of
The Wagner Daily or to learn about Deron’s other services, visit
morpheustrading.com or send an e-mail to
deron@morpheustrading.com .
Â
