When The Optimal Triggers Have Passed, Here’s The Rule Of Thumb
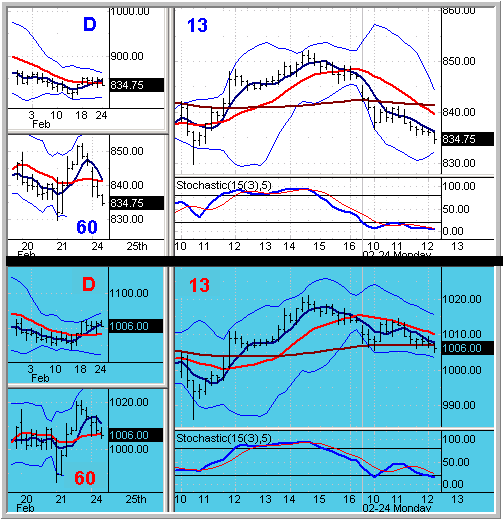
Friday’s closing 13-minute
downtrends remain intact on both major markets and have been joined by the S&P
hourly, making all ES trends above
three-minute short, as we go to press. Given that the optimal 13-minute trigger
with the daily backdrop occurred late Friday, astute ES traders looking to get
short were left with looking for lower-risk pullback entries this morning, which
admittedly required some patience and skill given the opening gap down. Yet
relatively safe pullback entry options did occur, one at around 9:50 AM and one
at 11:10 AM for those opting for a lesser timeframe continuation trigger over a
fade.
My general rule of thumb when the optimal triggers have passed is to reduce the
lot sizes, which has been the theme of much of the morning. Folks holding
overnight on the trigger did better, although such an entry would have been
riskier since the hourly hadn’t yet turned down — a tough place to be in an
overnight position, in my view.
Friday’s midday bullish cup described in
my last column indeed provided enough coil momentum to bust the hourly into
an intraday uptrend, and there were several long entry options on the
turn. Those traders with the deft mental flexibility to turn long when the tide
turned would have followed up a nice morning on the short side with a strong end
to the week in what was one of the better trading days for those who enjoy
multiple trading multiple oscillations.
Heading into the afternoon, we’re once again back in a “longs for scalps only”
environment until the 13 & 60 turn back up. Considering that both charts are
short in the context of a daily downtrend which is showing signs of potential
stalling in terms of both price and momentum, the bulls will have to make a
strong line in the sand if this submarine is to come up for air.
Lastly, I received a lot of mail over the weekend (must have been the snow),
much of which asked about the two-minute chart displayed on Friday’s morning
trade log. For those familiar with the
video and
simulation methods that use
one- and three-minute examples, the two-minute chart is certainly an micro-chart
option for those who prefer fewer charts and/or want to conserve on screen
space. By adjusting our standard 5 & 15MAs to 8 and 25 on the two-minute, you
would essentially be seeing both the one- and three-minute trend supports (1
minute x 15 / 2 = approx. 8; 3 minute x 15 / 2 = approx. 23, although you can
adjust it 25 if you want it to double as the 1 minute 50). As always, it’s up
to personal preference.
ES (S&P)
Monday February 24, 2003 12:00 PM ET NQ
(Nasdaq)

Moving Avg Legend:
5MA
15MA 60-Min 15MA
See
School and
Video for Setups and Methodologies
Charts ©
2002 Quote LLC
Good Trading!
