Where I’m Shorting JetBlue, Part 2
This stock
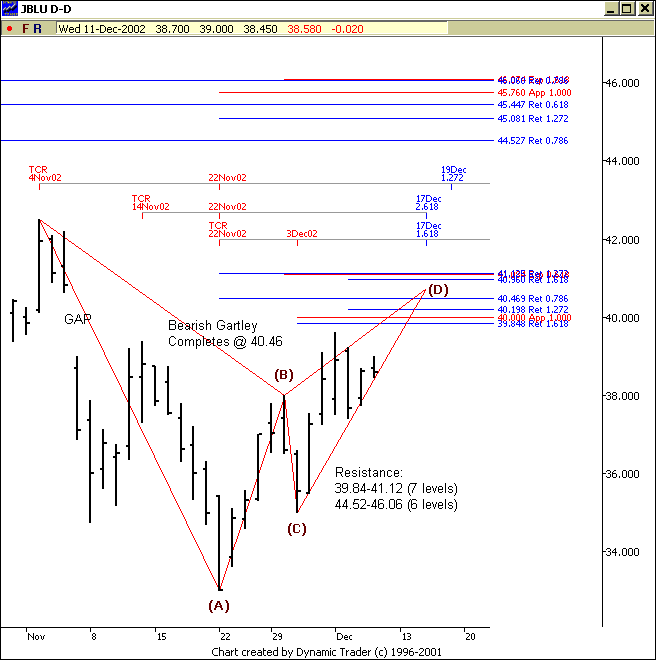
continues to play around key parameters for a potential short. To review, here
is what we are looking at:
1) Immediate Fibonacci
price resistance zone from 39.84-41.12
2) Bearish Gartley pattern
that completes within this zone @ 40.46
3) New
time cycles coming into play between the 17th and 19th (+/- 1 day) for a reversal
to the downside
Something to
note here is that if JetBlue
(
JBLU |
Quote |
Chart |
News |
PowerRating)
is able to clear the first resistance zone, there is a good chance this stock
runs up 3 points quickly to the next Fibonacci
price resistance zone from 44.52-46.07. So, with time cycles, price resistance,
and pattern, I’m definitely waiting tight for a short opportunity. That’s the
tough part…sitting on your hands.

