Where the EUR/USD May Head Next
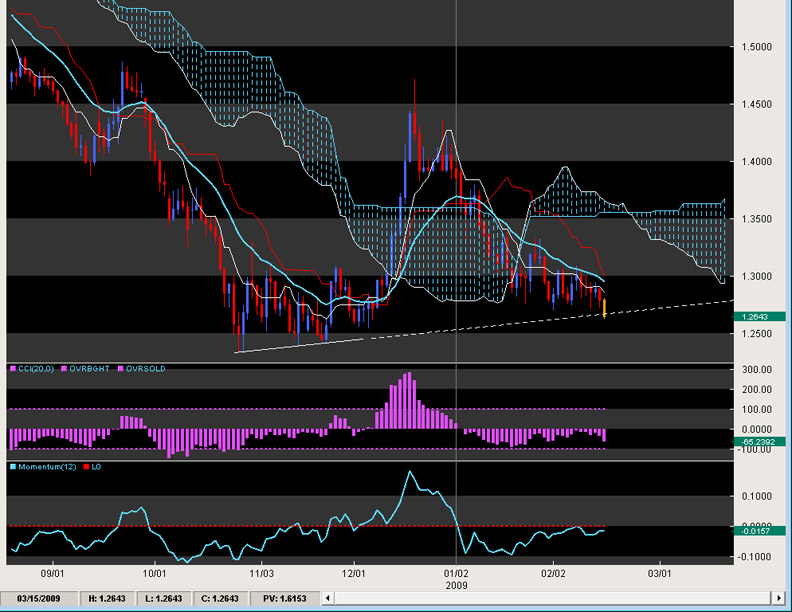
The technical soothsayer’s omens for this pair may be coming a month early as the pair is threatening a break below the 5 month trendline while creating new lows for the year. A look at the charts below give some good hints as to the possibility of a fall and to where.
As we noted last week, on the daily charts – the pair had less than a handful of days above the 20EMA with the rest of the party this year below it – not very good for technical bulls. With the 20EMA declining steadily and rejecting every upward attempt, the outlook was deteriorating technically and not much relief was to be found in the charts.
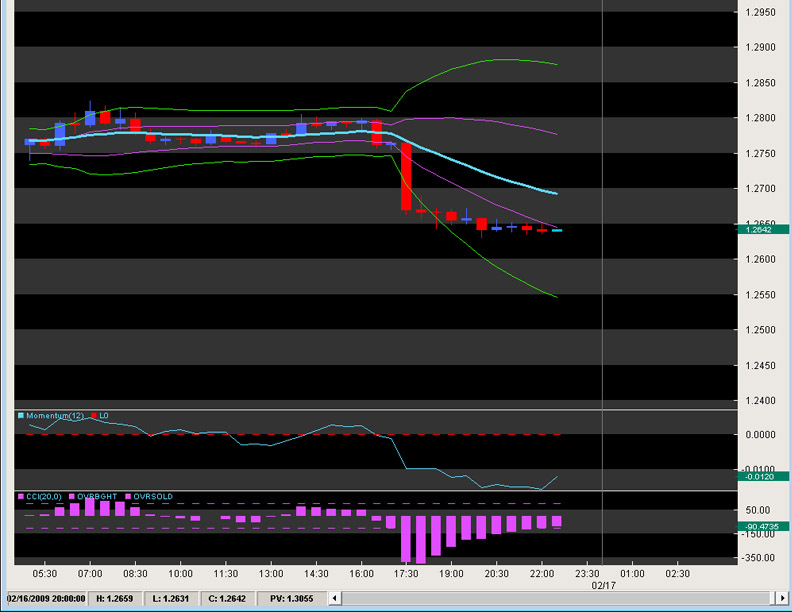
Taking a look at the intraday chart below, after a dull drum of a session post London close today (with the U.S. on holiday), nothing much happened till Tokyo opened. Then the pair went on a peregrine falcon dive dropping about 100 pips in 1hr. It sank below the M1 pivot (generally not a special one) and never surfaced more than a handful of ticks to now attack the S1 pivot. With the awful intraday momentum and CCI, we expect at best a retracement to the 1.2750 level on any intraday rally. What is more interesting is the Daily chart below which shows the previous mentioned trendline.

The lower part of the trendline has been touched three times in 2008 and only flirted with in 2009. Now the full court press is on and if the yellow candle continues to flirt with the mastery of Hitch (Will Smith movie) to the south side, we can expect at least a move towards the big figure at 1.2500. However, noting the 20CCI has never made it above the zero line in 2009, and with momentum also getting rejected looking quite paltry (combined with a declining cloud) we expect this pair to head towards the yearly lows for 2008 around the low 1.2300 level if the pair closes below the noted trendline. Any daily close below 1.2300 could allow the Sword of Damocles to fall on this pair and send it reeling towards the 1.20figure in two shakes of a happy dogs tail. Any upside rallies that are not too impulsive and attack the daily 20EMA should be seriously considered for a rejection play back down towards the mid 1.27’s

Chris Capre is the Founder of Second Skies LLC which specializes in Trading Systems, Private Mentoring and Advisory services. He has worked for one of the largest retail brokers in the FX market (FXCM) and is now the Fund Manager for White Knight Investments (www.whiteknightfxi.com/index.html). For more information about his services or his company, visit www.2ndskies.com.
