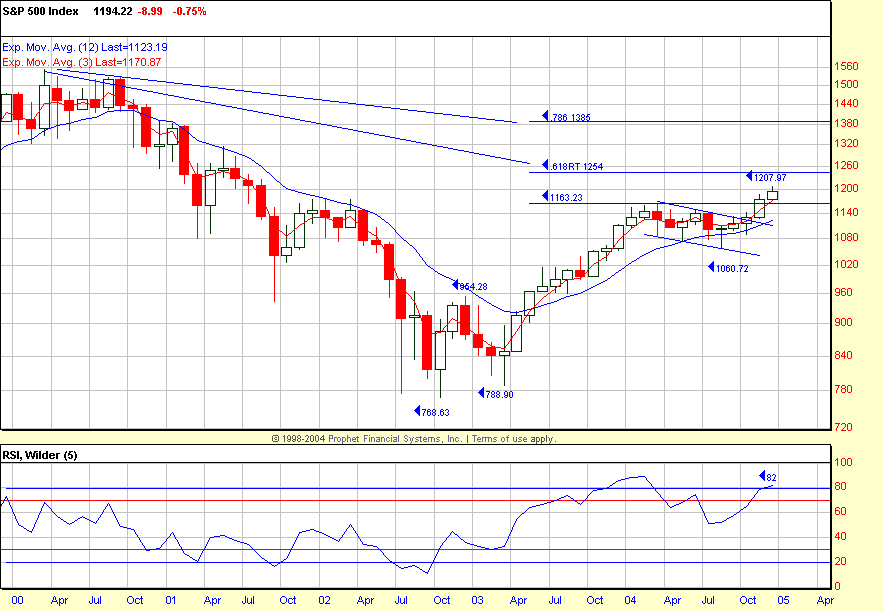
Where Will Leg 5 End? Stay Tuned…
What Friday’s Action Tells
You
It was the normal big December option
expiration
with an expansion of NYSE volume to 2.47 billion shares and the SPX
(
$SPX.X |
Quote |
Chart |
News |
PowerRating)
closing at 1194.22, -0.8%, which was also at the initial minor support of
1194.50 (12/17 commentary). The volume ratio was 40 as the programs were to
the
sell side, and breadth was neutral at just -22. The Dow
(
$INDU |
Quote |
Chart |
News |
PowerRating),
10,650,
and Nasdaq
(
$COMPQ |
Quote |
Chart |
News |
PowerRating) were both -0.5%, with the
(
QQQQ |
Quote |
Chart |
News |
PowerRating),
39.45, -0.2%.
The market action was very skewed to the
expiration, so it doesn’t tell you much. Two of the sectors closed green,
with
the BBH +1.4% and the
(
OIH |
Quote |
Chart |
News |
PowerRating) +0.5% while the rest of the sectors were red
and
in line with the SPX, other than retail, with the RTH -1.3%.
For Active
Traders
The
(
SPY |
Quote |
Chart |
News |
PowerRating) made a +.27 move out of a
triangle
that formed within the range of the first bar which was 119.86 – 119.37. The
stop
was -.11, so the advance to 119.97, above the 119.70 entry, got to 2.4x
risk, so
if you sold half and kept half, you scratched on the balance because you had
moved
your stop to breakeven at 2x risk. The 119.37 first-bar SPY low was in
conjunction with the SPX low of 1196.51 vs. its -1.0 volatility band of
1196.20.
The SPY 119.41 level was also the 2.24 extension of the last leg up, which
was
120.22 – 120.87 on Thursday.
The
(
DIA |
Quote |
Chart |
News |
PowerRating)s traded to 106.25 which was our
initial interest level of 106. The -1.28 volatility band was 106.25. The DIA
rallied back to 106.71 on that same bar and then to 107.18 after a small
jiggle
back to 106.54. That was not an RST buy entry above 106.71 because the range
was
too steep to enter a trade after it traded at the 106.25 low.
Today’s
Action
Action will slow into Christmas Eve on
Friday,
but Monday and Tuesday could be active. Hopefully we will get some more
retracement from the SPX which might give us some good daytrading action, or
even a short-term trade into year-end. The SPX closed at 1194.22 and the
10-day
EMA of 1194.76 with the 1191 and 1187 minor support levels below that before
price re-enters the 1184 – 1170 trading range. The ideal move from a trading
standpoint is an air pocket into the middle to low end of that 1184 – 1170
range, and that will get the Generals active in their major holdings, so
short-term traders might catch a move. The three-month EMA for the SPX is
1170.87 and rising, as is the 12-month EMA, now 1123.19 (see monthly chart).
The
initial confluence of resistance for the SPX is the 1225 – 1230 zone
followed by
1254. For now, it is only a question of where Leg 5 ends, so stay tuned
because
we are not there yet. The monthly chart with a three- and 12-month EMA keeps
all
subjective long-term commentary honest and objective.
It has been a good year-end move so far off
the
10/25 SPX 1090 low. The gain so far to the 1208 high is +10.8%, and the
Generals will attempt to hold as much of it as they can into
year-end.
Window dressing in the last 5 – 10 days is
what
the empty suits on TV call a year-end rally, but the institutions start well
before that to add gains if they can. It is, obviously, also a function of
what
kind of market we are in, so let’s take a look at the year-end moves since
2000.
color=”#0000FF”>Table
| size=”2″>Date-Of-Low | Price | Percentage Gain |
|
| size=”2″>2000 | size=”2″>12/22/00 | size=”2″>1254 – 1320 | size=”2″>+5.3% |
| size=”2″>2001 | size=”2″> 09/21/01 |
size=”2″>945 – 1148 |
size=”2″> +21.5% |
| size=”2″>2002 | size=”2″> 10/10/02 |
size=”2″>769 – 880 |
size=”2″> +14.4% |
| size=”2″>2003 | size=”2″> 11/31/03 |
size=”2″> 1031 – 1112 |
size=”2″> +7.9% |
| size=”2″>2004 | size=”2″> 10/25/04 |
size=”2″> 1090 – 1208 |
size=”2″> +10.8% (so far) |
Other than 2000, the first year of the bear
market, the year-end moves are not Christmas rallies. They start in the
fall. We
caught this year’s move from a key time and price zone at 1090, which was a
.618
retracement to the 1060 August low and also a retracement to the rising
200-/233-day EMAs (Generals’ Pullback for those of you who have the seminar
materials). The time dates were 10/22 and 10/25, so that was on the money.
The
next primary entry after 1090 that had sequence was above 1161, which is the
.50
retracement to the 1553 2000 top from the 769 October 2002 low. That put the
SPX
in Leg 5 of this current bull cycle.
The year-end window dressing is to maintain
existing gains, which is the case this year, and then add what gains they
can in
the last five to 10 trading days to their major holdings. A retracement
before
the last five to 10 days of the year is the best opportunity for daytraders
and
the two- to three-day moves for short-term position traders. So far, the SPX
has
not complied and has only dropped to an intraday low of 1174, closing that
same
day at 1189.84, so unless that happens, it is daytrade only into
year-end.
Have a good trading day,
Kevin Haggerty

