Which ETF is ready to move? Here are my favorites
Another quarter-point interest rate
hike by the Federal Reserve Board sent the Nasdaq lower yesterday,
causing the index to register its second consecutive “distribution day.” When
the Feds announced the rate hike and outlook going forward, the broad market
initially became very volatile, causing the major indices to whip violently in
both directions. The Nasdaq Composite Index
(
COMP |
Quote |
Chart |
News |
PowerRating) eventually closed near
its intraday low and lost 0.8%, but the S&P 500 Index
(
SPX |
Quote |
Chart |
News |
PowerRating) recovered off
its low and slipped only 0.2%. The Dow Jones Industrials
(
DJX |
Quote |
Chart |
News |
PowerRating) continued to
exhibit relative strength by finishing unchanged, but the small-cap Russell 2000
Index mirrored the Nasdaq’s weakness and lost 0.6%. The S&P Midcap 400 declined
0.2%.
The most troubling thing about yesterday’s action was that the
Nasdaq fell victim to its second straight day of institutional selling. Total
volume in both the Nasdaq and NYSE exchanges was 6% higher than the previous
day’s levels. As such, the S&P also registered a bearish “distribution day,” but
there have been far more days of institutional selling in the Nasdaq than in the
S&P and Dow. How many more days of institutional selling can the Nasdaq
withstand before the index collapses from the overhead supply? Obviously, nobody
knows for sure, but all of this corresponds to what we have been saying over the
past week — avoid the tech sectors because the Nasdaq has been showing so much
relative weakness.
If you downloaded and checked out our
new ETF Roundup
that was announced yesterday, you probably became aware of numerous exchange
traded funds that you never knew existed. One such ETF that many traders are not
aware of, yet has been acting great, is the PowerShares Lux Nanotech Fund
(
PXN |
Quote |
Chart |
News |
PowerRating).
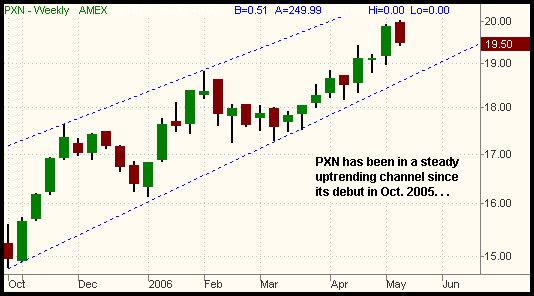
This ETF, which is comprised of various stocks associated with nanotechnology,
has been in a steady uptrend since its launch in October 2005. We have
illustrated this with trendlines on the weekly chart below:

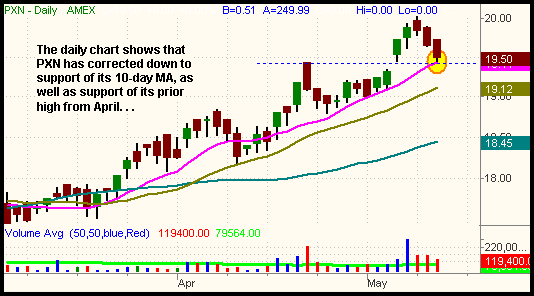
If you drill down to a shorter-term daily chart, you will also
see that PXN has corrected over the past three days and closed yesterday right
at support of its 10-day moving average. Further support of its 20-day moving
average is just below that:

Although we discuss the 20 and 50-day moving averages more
frequently, the 10-day moving average is useful for anticipating support levels
on stocks and ETFs that have entered a strong uptrend. Often, we will make our
initial buy entry of partial position size when an ETF when it retraces down to
support of its 10-day MA. If it continues a bit lower, we usually will add to
the position around the 20-day moving average. If, however, it turns back up at
the 10-day MA, we typically just remain with a partial position size. Note that
when adding to a position as it pulls back further, this is different than
averaging down on a losing position because our initial plan from the
first entry was to add on a further retracement. The key is just to make sure
that adding was part of your initial plan and not something you did because you
are “hoping” that a losing position will come back to your entry price.
Taking an updated look at the major industry sectors, it is
good to see that the DJ Utilities Average
(
DJU |
Quote |
Chart |
News |
PowerRating) bounced off new support of
its 200-day moving average yesterday. As you may recall, we bought the Utilities
HOLDR
(
UTH |
Quote |
Chart |
News |
PowerRating) when it broke out on May 5 because it had a similar chart
pattern to $DJU. The current daily chart of UTH below is a great example of how
a prior resistance level becomes the new support level after the resistance is
broken.

The Gold Index
(
GOX |
Quote |
Chart |
News |
PowerRating) keeps on chugging along, steadily
setting fresh 25-year highs. Spot gold rose over $700 per ounce this week,
pushing the Gold Trust (GLD) along with it. Although gold certainly remains in a
strong uptrend, it is a bit risky to initiate new positions in GLD or any of the
mining stocks at current levels. If, however, you were clever enough to
already be long, there is no need to pick a top. Instead, consider just
tightening your stops to below support of the hourly uptrend lines.
Transportation
(
DJT |
Quote |
Chart |
News |
PowerRating), Banking
(
BKX |
Quote |
Chart |
News |
PowerRating), and Retail
(
RLX |
Quote |
Chart |
News |
PowerRating) are two other
sectors that continue to show solid relative strength. The $RLX Index is now
consolidating near its 52-week high, so keep an eye out for a potential breakout
in that sector.
On the downside, the biggest problem area is the Semiconductor
Index
(
SOX |
Quote |
Chart |
News |
PowerRating). Throughout the latter half of last week, it looked as it the
$SOX was building up momentum for an upside break out of its long trading range.
However, the action of the past three days has been quite negative and all bets
are off on the $SOX Index. Looking at the daily chart of the $SOX below, notice
how it failed last week’s breakout attempt and has dropped back below its 50-day
moving average:

Without a doubt, the recent weakness in the $SOX
has weighed heavily on the Nasdaq. Both the Networking Index ($NWX) and Computer
Hardware Index ($HWI) have also begun to roll over, but the Internets ($GIN) may
be putting in a base of support here. The Broker-Dealer Index ($XBD), which we
discussed extensively last week, closed yesterday at a three-day low. That
sector may see further downward momentum, at least down ot its prior low. As per
the ETF Roundup, IAI and KCE are two exchange traded funds that track the
broker-dealer sector.
Open ETF positions:
Long UTH, short XLE (regular subscribers to
The Wagner Daily
receive detailed stop and target prices on open positions and detailed setup
information on new ETF trade entry prices. Intraday e-mail alerts are also sent
as needed.)
Deron Wagner is the head trader of Morpheus Capital Hedge Fund and founder of
Morpheus Trading Group (morpheustrading.com),
which he launched in 2001. Wagner appears on his best-selling video, Sector
Trading Strategies (Marketplace Books, June 2002), and is co-author of both The
Long-Term Day Trader (Career Press, April 2000) and The After-Hours Trader
(McGraw Hill, August 2000). Past television appearances include CNBC, ABC, and
Yahoo! FinanceVision. He is also a frequent guest speaker at various trading and
financial conferences around the world. For a free trial to the full version of
The Wagner Daily or to learn about Deron’s other services, visit
morpheustrading.com or send an e-mail to
deron@morpheustrading.com .
Â
Â
Â
