Which Moving Average Should We Use?
Should we use the
exponential moving average or simple moving average? This is the
question I receive often from our members. My answer is: I use both of them. The
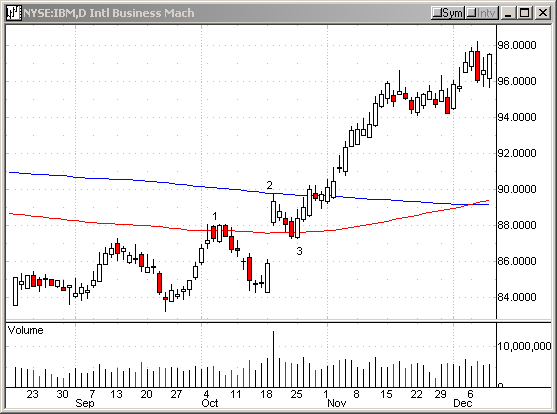
daily chart below is IBM. The red line is the 200-day EMA, and the blue
is the 200-day SMA. Can you see it? At the point 1, the EMA was a resistance. At
the point 2, the SMA became a barrier. At the point 3, the EMA acted as a
support.

11:08:22 (From TradersWire)
![]()
|
Action |
Symbol |
Order Type |
Setup |
Stop |
Target |
Current Price |
Posted By |
|
Buy |
CKFR |
buy stop at 39.01 |
Pullback |
38.79 |
39.20 |
39.00 |
TK |
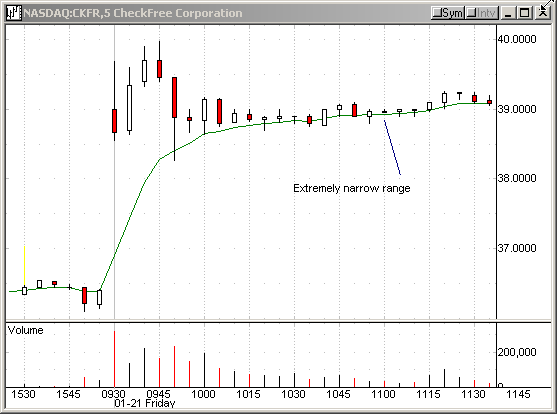
CheckFree (CKFR) pulled back from the
intraday high, and it began to consolidate right at the 8-period EMA on the
5-minute chart. Especially, the bar formed at 11:00 AM was extremely narrow. I
thought the stock was ready for a bounce. It sounds too simple, but so often we
see wide range bars after narrow range bars.
11:30:31
Follow up on CKFR (Pt.2)
Selling the rest. It looks overbought. (+0.20)

If you have questions, feel free to mail them to me.
