Why Do I Use Four Time Frames?
Both major markets ended a
bearish week in the green on Friday by
bouncing off extreme hourly strength price vs. momentum divergences set in place
during Friday’s early morning Globex session. Yet for the week, both the S&P
and Nasdaq suffered steep losses with the S&P losing 39 and the Nasdaq giving
back 43.
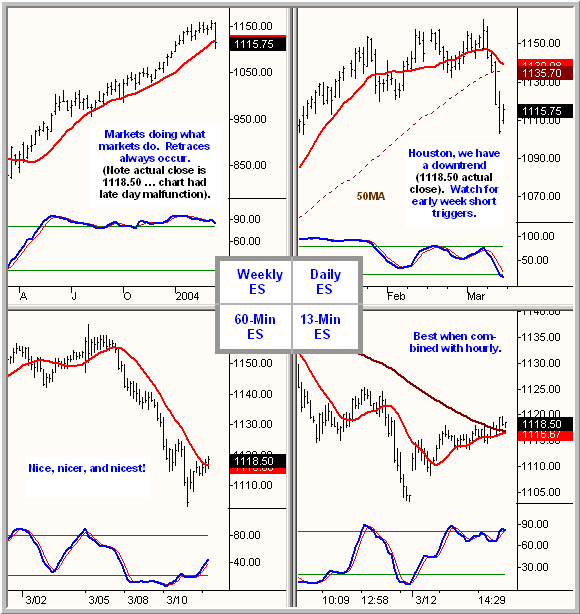
On the longer-term charts, the S&P retraced to its weekly 15MA trend support for
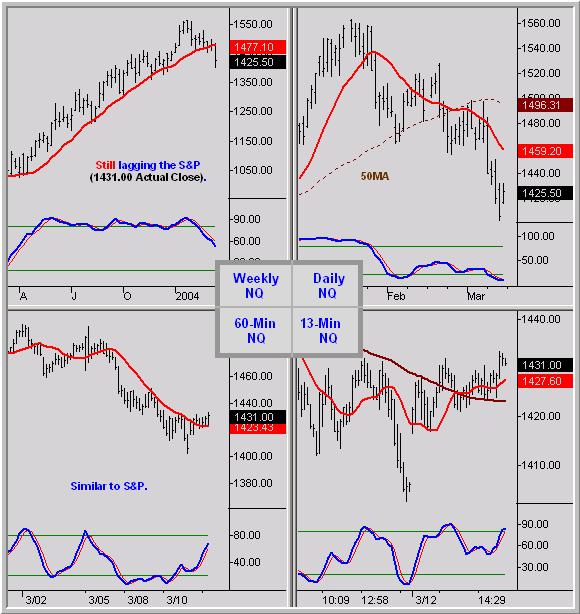
the first time since 2003, and finally joined the lagging Nasdaq in a daily
downtrend as it broke both its 15MA and 50MA like a Todd Bertuzzi punch. Such
action sets up possible daily vs. weekly ping-pong triangles on the S&P early
next week which will include early daily pullback shorts when triggered.
With respect to short term action, intraday trading opportunities continue to be
nothing short of stellar with the hourly playing lead dog — pun intended — all
week. The increase in volatility has also been a welcome sight, keeping in mind
traders may want to adjust their lot sizes for the increase in action, an
adjustment often overlooked when trade pace changes.
Let’s hit the charts and then talk about what, in my view, is the most
important technical aspect of this crazy business.
S&P 500

Nasdaq

Moving Avg
Legend: 15MA
Larger Timeframe 15MA
See https://www.donmillertrading.com
for Setups and Methodologies
Charts © 2003 Tradestation
Timeframe, Timeframe, Timeframe
To borrow from the real estate folks, if
you were to ask me to list the three most important technical aspects of
trading — technicals which in my view are far less important than trade
psychology — I’d say timeframe, timeframe, and timeframe. And I mean this
with the utmost seriousness.
Many video and course folks are of course familiar with my preferences to use
trend, momentum, and range indicators. And while I prefer to use simple moving
averages, stochastics, and Bollinger bands to define each variable, the actual
indicator selected is less important than the need to balance the market on
multiple timeframes.
For example, there are various trend indicators — in fact a plethora if you
include the various way to define moving averages — as well as a host of
momentum indicators of which stochastics is simply one. Yet we have to settle
on something, and I’ve chosen the MA, stochastics, and Bollinger Band trio.
So that brings us back to timeframes. Since I began this column some three
years ago, every column has included the indices on at least three timeframes.
And when we migrated to the weekly format last year, we increased it to four as
noted above. There’s a clear cut reason for doing so, as I never believe in
discussing market patterns — even with my daughter’s pet fish — without
reference to at multiple perspectives.
One of the aspects I’ve improved at over the years is adapting my intraday
trading to the trend which is “in play”. For example, I remember my early years
when I chose to trade a particular timeframe, opting to sit out when its
patterns provided low probability trades. Or we can talk about forcing
trades on said timeframe … a neighborhood that still gets visited from time to
time, although on far less frequency. And while adapting to different
timeframes can be difficult on the mind for some, such flexibility is critical
if one’s goal is a fairly consistent income flow on a daily basis,
whether the market trends up/down 20 points or simply chops around.
Another important reason to maintain what I’ll call adequate “timeframe” focus
is to effectively block out the world’s market narrative — world meaning
the general trading press, CNBC, and even strong technical narratives that may
simply view market technicals differently — so it won’t hinder one’s focus on
the timeframe in play at any given moment.
This week’s S&P market retracement was neither unusual nor unexpected — when
considering the weekly trend extension which we’ve been watching for months. It
was simply a matter of time … or perhaps better stated — timeframe.
Good Trading and Have a
Great Weekend!
