Why Dow Jones Could Rally This Week
TradingMarkets subscribers have access to
16 quantitative
stock indicators and another
17 quantitative market bias indicators. These indicators are derived from
our proprietary database that includes millions of trades, and designed to give
you a short-term trading edge.
There are 8 bullish and 8 bearish stock indicators, providing trading ideas for
both rising and falling markets. When used in conjunction with the market bias
indicators, traders can potentially achieve a substantial edge.
Each day, we provide free open access to one of these proprietary stock
indicators. If you would like to access all 16 stock indicators, 17 market bias
indicators, along with many other tools, click here for a free
focus list
that comes from our
5+ Consecutive Down Days list, which will be available until around 1 PM
Monday afternoon.
These are stocks that have closed down for five or more consecutive days and
are trading above their 200-day moving average. Our research shows that
stocks trading above their 200-day moving average that close down for five or
more days have shown positive returns, on average, 1-day, 2-days and 1-week
later. Historically, these stocks have provided traders with a
significant edge. To learn more about our research into stocks that make five,
or more, consecutive down days, and how to use this information,
click here.
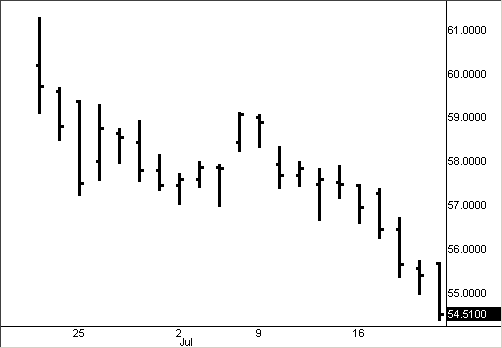
Let’s take a closer look a chart from the list above. Keep in
mind that this is only one example from the indicator list, and that we are not recommending a trade
in this particular stock. Traders should always create individual focus lists
and radar screens based on their own information and trading strategies, instead
of blindly following other people’s recommendations.
Dow Jones
(
DJ |
Quote |
Chart |
News |
PowerRating)

Dow Jones (DJ) is trading above its 200-day moving average, in a
confirmed uptrend. Simply stated, this stock has gained more over the past 200
days than it has lost. This is mostly because of the M&A rumors with Murdoch’s
News Corp, but the fact remains that price is above the major moving average. By technical definition, this is a strong, uptrending stock. The TradingMarkets mantra is to “buy weakness, and sell
strength,” and that is what we would be looking to do here. Our database of
literally millions of trades proves that an edge to the long side exists when a
strong stock falls to extended, weak levels. After falling for 7 consecutive
days, it’s clear that this stock is trading at extended levels. As the price per
share of JADE becomes more and more extended to the downside, the bullish edge
continues to grow.
You can find the full list
here. Also, Check out our
latest quantified research articles
here. If you don’t already have a TradingMarkets subscription, click here
for a free 7-day trial. Check back daily for
7 Trading Ideas for Today,
and develop your own watchlist of stocks with historically-backed edges.
John Lee
Associate Editor
Reminder: We are in no way
recommending the purchase or short sale of these stocks. This article is
intended for education purposes only. Trading should be based on your own
understanding of market conditions, price patterns and risk; our information is
designed to contribute to your understanding.
Learn how to enter
markets at short-term lows and highs with a market maker’s edge. Find out what
specialists, hedge funds, large fund managers, and market makers are doing
behind the scenes at key times.
Join TradingMarkets
CEO Larry Connors for a free 45-minute market timing presentation on Thursday,
July 19, 03:00 PM ET.
Click here to signup.
