Why every option trader loves trading ranges
S&P100 traded strongly higher last week, and remains in a trading range.
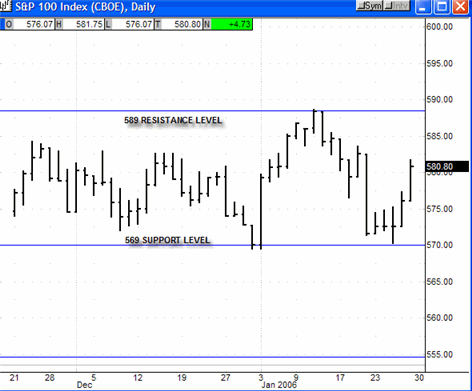
As evidenced by the chart below, financial markets have been trading in a fairly wide trading range for the past two months between the 569 and 589 levels on the S&P 100 index. As of the close on Friday, the S&P 100 index was in a short-term uptrend moving back up towards the top its trading range to the 589 level.
From a longer-term perspective, the current movements in the stock market are not surprising. Here are the facts. The S&P 100 index closed at the 575.29 level on December 31, 2004. The index is trading at the 580.80 level presently, or essentially unchanged for the past year.
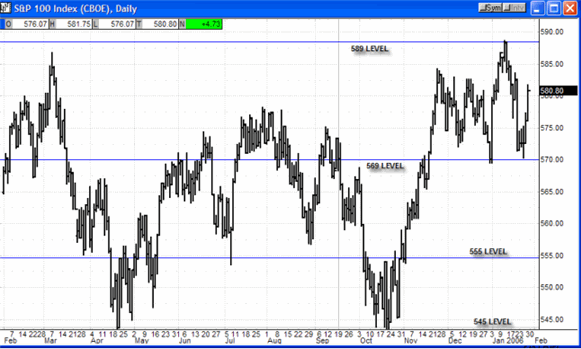
In looking at the charts below, we see that the S&P 100 index has traded in a very narrow range for most of the last year between the 555 and 589 levels.

In essence, nothing has happened in financial markets for the past year. The total yearly range for the S&P 100 index in 2005 from its lowest to its highest price was 8%, and the index was locked in a very narrow trading range of about 6% for most of the year.

While very little has happened in financial markets for over a year, this does not mean that there were not excellent opportunities to profit with options. Options have the unique characteristic of being able to earn profits when the security underlying the options sits still by using the time depreciation characteristic of the options. This means that by selling options, one can profit when financial market conditions are static as they have been in the past year.
Using the time depreciation characteristic of options, our recommendations have accrued over 126% in profits (excluding brokerage fees) since July 2004, without a single losing trade recommendation and are up 14% in the past 2 months. We have achieved these results while financial markets have been essentially unchanged.
Bottom Line:
From a longer-term trading prospective, it is likely that financial markets will remain in the trading range set forth in the long-term chart above. This means that traders can look to execute long positions when the S&P 100 index declines to between the 543-555 levels and seek to take profits, or enter short positions when the index rises to between the 577-585 levels. Long-term option traders should sell time premium to benefit from static financial markets.
From a shorter-term trading prospective, it is likely that financial markets will remain in the trading range set forth in the short-term chart above. This means that traders can look to execute long positions when the S&P 100 index declines to the 569 level, and seek to take profits, or enter short positions when the index rises to the 589 level. Tight stops should be used to ensure financial markets don’t break sharply below the 569 level or rise above the 589 level on any future breakouts.
Sincerely, Charles Sachs Chief Options Strategist
Charles Sachs has utilized S&P 100 for the past 14 years, both as a trader and an advisor. He uses 24 proprietary indicators in order to structure options strategies which can generate gains whether the market moves up, down or sideways.
