Why I Look At Multiple Time Frames
Let’s take a look at some charts
of Embraer-Empresa Brasil ADS
(
ERJ |
Quote |
Chart |
News |
PowerRating), since lately it has provided some nice
short triggers in multiple time frames. ERJ’s fundamentals meet many of the
criteria that an intermediate or long-term trader might look for in a short-sale
candidate. These include many poor Investors Business Daily
ratings. Earnings and relative strength ratings can also be checked using the
Tradingmarkets’ Stock Scanner, and these ratings were also low.
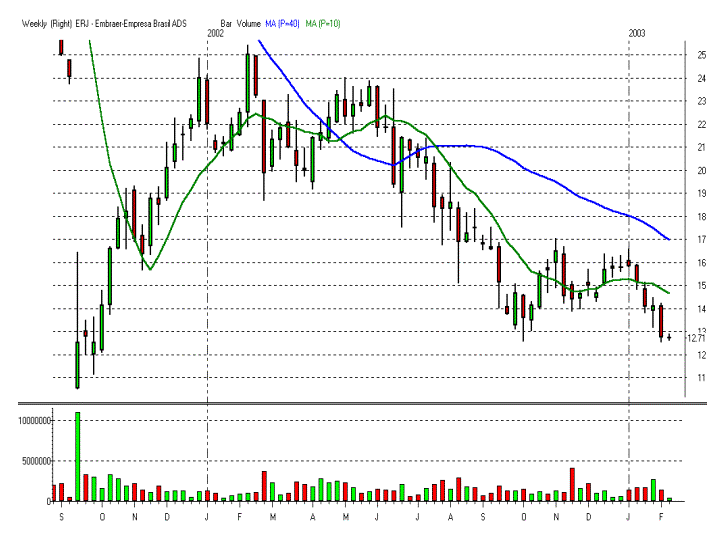
First, let’s look at a weekly chart. As you can see, since
the large gap down after the 9/11/01 attacks, ERJ has formed a huge inverted cup
& handle base. The low of the handle was $12.60, making the pivot point $12.50.

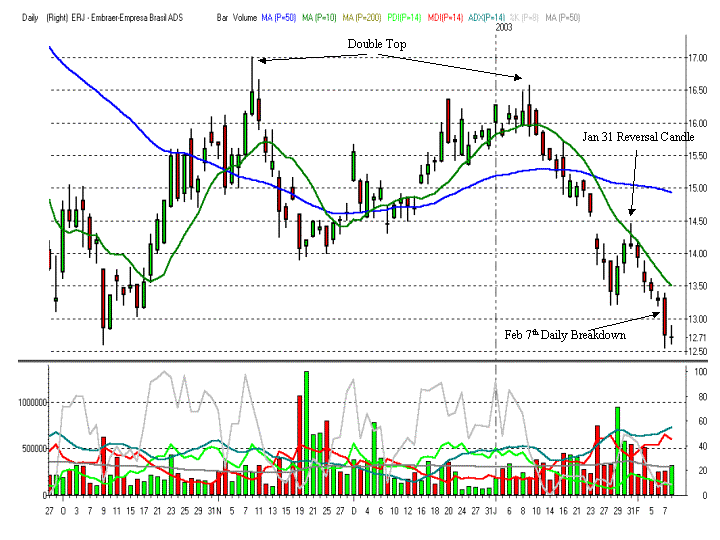
The daily chart is even more interesting. Here we see that
the “handle†from the weekly chart, looks like a double-top formation on the
daily chart. The strong downtrend from Jan. 9 to Jan. 28 formed the right side
of the double-top. The stock then pulled back from this downtrend for three
days. This pullback could have been viewed as a handle formation by an
intermediate-term trader looking to enter short in the hope of a breakdown of
the double-top base. Swing traders would have taken an earlier entry.Â
On Jan. 31, the stock set up for several swing trade entry
triggers. These include Cooper “1-2-3-4†and “180†patterns, and a Landry
“Simple Pullback.†Candlestick traders will also note that Jan. 31 was a “doji.â€Â
This pullback also touched the declining 10-day simple moving average (green
line), and partially filled in the gap from Jan. 23 and 24. The
14-day ADX on Jan. 31 was a huge 49 and the —DMI was greater than the +DMI. Lastly,
the price high on Jan. 31 was within three cents of the 0.382 Fibonacci
retracement of the Jan. 9-28 downtrend. All of these factors combined would
have told the astute swing trader that the odds were in their favor on a
confirmation of this reversal.
 
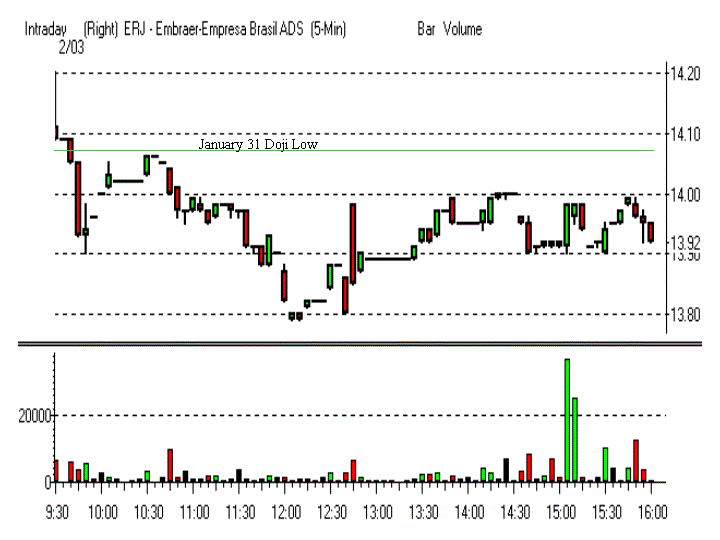
A five-minute chart from Feb. 3 shows that the Jan. 31
“doji†lows were broken pretty quickly, but the pullback on lighter volume over
the next hour would have provided the swing trader plenty of opportunity to
enter the trade.

Over the next several days the swing trader would have seen
some nice profits. On Feb. 7, the intermediate term trader who was waiting for
the break of the double-top “handle†would have received their entry
trigger. This would have occurred around $13.10, or $0.10 below the low of the
“handle†at $13.20.Â
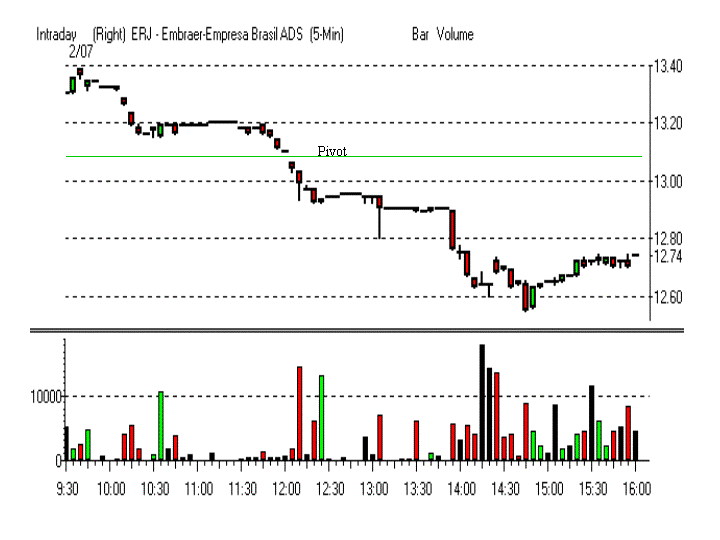
As you can see from the Feb. 7 intraday chart below, there
was some tight congestion between $13.10 and $13.20 for about an hour and a half
between 10 am and 11:30 am. (Daytraders note: Strongly downtrending stock forms
a Slim Jim near support. Opportunity knocking.) This is typical action when a
stock is trading near a pivot point. Swing traders would want to be aware of
this potential support area for two reasons: 1) It may have served as a good
place to take partial profits in case the downside momentum was unable to push
the stock through this level. 2) A break of this area could signal even greater
profits.
 
Everyone who was in this trade on Feb. 7 should have then
realized that the low of the “handle†on the weekly chart was $12.60, meaning
the weekly chart pivot would be $12.50. This is our next potential support
area. Guess where the momentum stalled? Between $12.50 and $12.60. Today,
February 8, was a somewhat narrow range day just above that level. Whether the
stock reverses off this support level or breaks below it has yet to be
determined.
Day and swing traders need to be aware of the weak
fundamentals as well as the bigger technical picture so they can anticipate
where the trade may stall. They also should be aware that if the momentum can
carry through these support areas that the trade could be a home run.Â
Intermediate and long-term investors would want to
recognize the short-term patterns here. From their standpoint, the knowledge of
these patterns would help them realize that there may be several short-term
players involved with this stock, and that could increase the volatility they
might experience.
With regards to the general market, in the last four weeks,
the S&P 500 is down 10.6% from its intraday high, the NASDAQ is down 11.6%, and
the Dow is down 10.7%. If you’re short…be careful. If you’re long…be more
careful.
Good trading,
Rob Hanna
P.S. Short-term traders who would like to read more on the
concept of using longer-term charts may want check out Mark Boucher’s archived
lesson titled “Why Short-Term Traders Should Use Long-Term Charts.â€Â It’s an
excellent read, and I suspect many of you have never noticed it, since
short-term traders may not think to look in Mark Boucher’s archives for ideas.
