Why I’m bullish on Biotechs and Semis
Stocks drifted modestly lower last Friday, as volume eased ahead of the holiday weekend. The Nasdaq Composite, still hampered by resistance of its daily downtrend line, fell 0.5%, but losses in the other indices were nominal. The S&P 500 declined only 0.2%, while the Dow Jones Industrial Average, mid-cap S&P 400, and small-cap Russell 2000 indices each lost 0.1% or less. The intraday action was lethargic overall, as the S&P 500 traded in a range of only five points throughout the entire session. For the week, the Dow Jones Industrials cruised 1.8% higher, the S&P 500 advanced 1.6%, and the Nasdaq Composite gained 0.9%.
Despite it being monthly options expiration day, turnover declined in last Friday’s session. Total volume in the NYSE fell by 6%, while volume in the Nasdaq was 2% lower than the previous day’s level. Lower volume levels are normal ahead of holiday weekends, but it was nevertheless positive that the day’s losses were not on higher volume. Furthermore, it is interesting to note that advancing volume marginally exceeded declining volume in the NYSE, regardless of the broad market’s decline. If stocks do not fall on higher volume in today’s session, it will confirm that last Friday’s absence of institutional selling was not only due to it being a pre-holiday session.
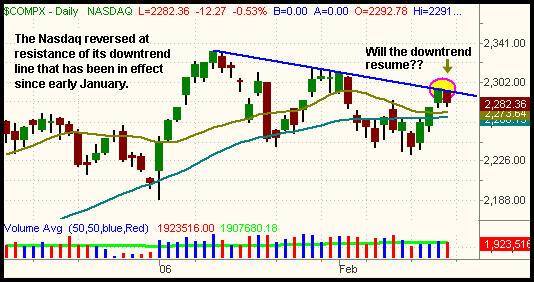
The Dow Jones Industrial Average broke out to a new four-year high last week, while the S&P 500 rallied above its daily downtrend line and closed only 0.5% off its 52-week high. However, the one negative in the whole equation is that the Nasdaq Composite still remains below its downtrend line. In the February 17 issue of The Wagner Daily, we illustrated how the Nasdaq was the one major index that failed to rally above its downtrend line. Not surprisingly, Friday’s 0.5% loss occurred right as the Nasdaq tested resistance of that downtrend line. Looking at the chart below, notice how the Nasdaq’s downtrend line perfectly acted as resistance last Friday:

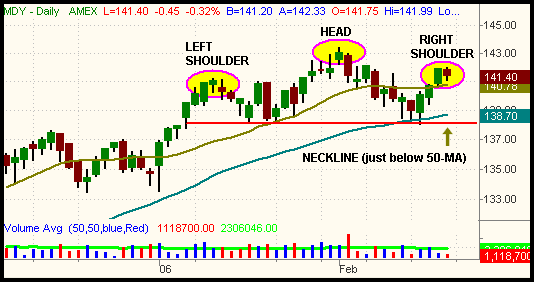
In addition to the Nasdaq, the S&P 400 also remains below its downtrend line, as well as overhead resistance of its prior uptrend line that it fell below on February 10. More importantly, it has formed a perfect right shoulder of a bearish “head and shoulders” pattern. As such, we continue to stalk MDY for a potential short entry. However, we will only short MDY if it breaks below its hourly uptrend line. A break of support on such a short-term chart helps to confirm the longer-term downtrend and “head and shoulders” on the daily chart. We have illustrated the “head and shoulders” on the daily chart of MDY below:

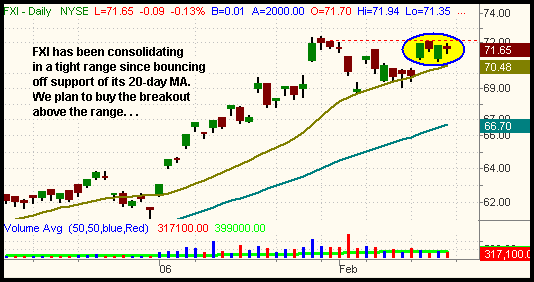
On the upside, several sectors are beginning to look pretty bullish. On the international front,
(
FXI |
Quote |
Chart |
News |
PowerRating) (iShares Xinhua China 25 fund) has been consolidating in a tight range since bouncing off support of its 20-day moving average two weeks ago. We passed on buying the gap up on February 14, but the consolidation of the past four days has helped to build a base of support that makes it “safer” to buy a subsequent breakout to a new high:

Regular subscribers should note our new trigger, stop, and target prices on the FXI long setup today, as well as updated details on the MDY short setup on “Today’s Watchlist” below.
As for specific industry sectors, the Biotech Index
(
BTK |
Quote |
Chart |
News |
PowerRating) closed last week at a new 5-year high. The three main ETFs that follow the Biotech stocks are:
(
BBH |
Quote |
Chart |
News |
PowerRating) (Biotech HOLDR),
(
PBB |
Quote |
Chart |
News |
PowerRating) (PowerShares Biotech), and
(
IBB |
Quote |
Chart |
News |
PowerRating) (iShares Biotech). Of the three, we would avoid BBH because it is showing the most relative weakness. This is due largely to the fact that it is not as diversified as the others. Genentech
(
DNA |
Quote |
Chart |
News |
PowerRating) and Amgen
(
AMGN |
Quote |
Chart |
News |
PowerRating) together represent more than 50% of the value of BBH.
In addition to the Biotechs, the Semiconductor Index
(
SOX |
Quote |
Chart |
News |
PowerRating) is also looking bullish on its weekly chart. Although the daily chart of the sector has been choppy and range-bound throughout this month, the longer-term weekly chart shows a bullish consolidation near the 52-week high that has been forming over the past four weeks. A breakout to a new high in the SOX would not only create several trading opportunities in the sector, but it could also pull the Nasdaq above its downtrend line as well.
(
IGW |
Quote |
Chart |
News |
PowerRating) (iShares),
(
PSI |
Quote |
Chart |
News |
PowerRating) (PowerShares), and
(
SMH |
Quote |
Chart |
News |
PowerRating) (HOLDR) are the three primary ETFs that follow the semiconductor stocks. A breakout above the consolidation in IGW and PSI is buyable, but SMH is again lagging the most of the three ETF
families due to a heavier concentration of Intel
(
INTC |
Quote |
Chart |
News |
PowerRating).
Our overall short-term view on the broad market is that stocks are giving many mixed signals right now. While several indices are breaking out to new highs, others are failing to recover. A handful of industry sectors are showing bullish consolidation patterns, but others are breaking support of key uptrend lines. The past several weeks have also seen numerous “distribution days,” but now the market has been showing more bullish volume patterns. Most importantly, many market-leading stocks sustained heavy technical damage over the past several weeks and they are not likely to recover quickly. When the major indices are out of sync with each other, we have found that choppy and erratic trading often prevails. Therefore, we feel your best bet right now is to maintain a mostly cash position. Doing so will enable you to act quickly in either direction when all the important technical signals give the green light. At the very least, consider positioning yourself on both sides of the market through buying sectors with the most relative weakness while simultaneously shorting those with the weakest patterns.
Open ETF positions:
We are currently flat. (regular subscribers to The Wagner Daily receive detailed stop and target prices on open positions and detailed setup information on new ETF trade entry prices. Intraday e-mail alerts are also sent as needed.)
Deron Wagner is the head trader of Morpheus Capital Hedge Fund and founder of Morpheus Trading Group (morpheustrading.com), which he launched in 2001. Wagner appears on his best-selling video, Sector Trading Strategies (Marketplace Books, June 2002), and is co-author of both The Long-Term Day Trader (Career Press, April 2000) and The After-Hours Trader (McGraw Hill, August 2000). Past television appearances include CNBC, ABC, and Yahoo! FinanceVision. He is also a frequent guest speaker at various trading and financial conferences around the world. For a free trial to the full version of The Wagner Daily or to learn about Deron’s other services, visit morpheustrading.com or send an e-mail to deron@morpheustrading.com .
