Why I’m expecting a short-term bounce
It has been a particularly brutal week for the markets. Since
the Federal Open Market Committee announcement on May 10, 2006, the S&P 500 has
been a freefall.
While the day trading has been very exciting and profitable, my 401K’s and IRA
accounts are going through a drawdown. Is it time to exit my stock positions and
go to cash? I decided to take a longer-term look at a chart of the S&P 500 and
see what an analysis of past market conditions might tell me.
I want to preface the rest of the article with a several caveats.
1. For this analysis I am using a proprietary system developed the
TradingMarkets Research team. This team, led by Larry Connors, released this
system in April of 2004. The system is called the
RSI 25 Explosion system. Since it is a proprietary system, I cannot divulge
the details of how the buy signals were generated.
2. While the system has had impressive backtesting results and winning trades
since the release of the system, there is no guarantee that future results will
be same.
3. I did “tighten up†the system parameters to make the effects of the sell off
and subsequent volatility even more extreme. This would create signals that
happened less often because the market conditions occurring now have happened
less often.
I used a weekly time frame. I did the analysis using the $SPX.X
(
SPX |
Quote |
Chart |
News |
PowerRating) symbol
in TradeStation. So what
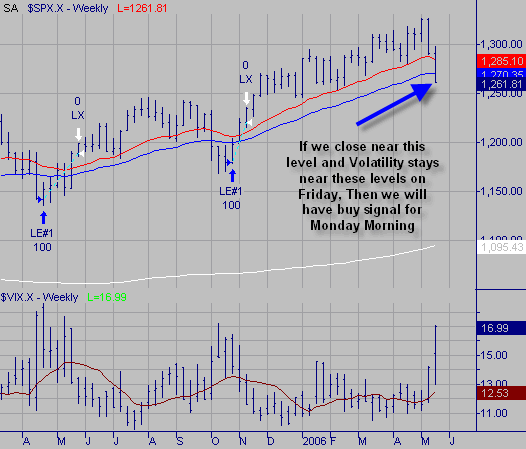
did I find? Since the week ending August 20, 2004, there have been two times
that we have had similar market conditions. These market conditions generated 2
buy signals by the slightly modified RSI 25 system. You will see these market
condition marked by “buy†signal arrows. If you remember back to the time, both
of the pullbacks were rather dramatic. Both of the signals were exited with a
profit 2 to 4 weeks later when an exit signal was generated.
If we close on Friday May 19, 2006 near the lows of today May 18, 2006 and the
volatility levels of the VIX
(
VIX |
Quote |
Chart |
News |
PowerRating) stay at a similar level, then we will
have a buy signal generated for Monday morning.

Again, I would like to stress that this analysis may prove to be incorrect. On
the other hand, with
PowerRatings
generating the extreme numbers of 9 & 10’s, this is just another indication that
the market may bounce soon. Ashton has written several informative
articles on the use of
PowerRatings
as a market-timing tool. If I am going to exit my 401K and IRA stock positions,
I might want to sell into strength, rather than panic at this point.
If you would like to discuss the methods of how the buy signals were generated,
I can be contacted at
johne@tradingmarkets.com.
Best Regards and Great Trading
John Emery
