Why I’m watching Semiconductor ETFs
A day after breaking below support of their four-day
trading ranges, the major indices crept back up, but chop and
indecision again prevented stocks from making much headway. The Nasdaq Composite
gapped 0.4% higher on the open, sold off to a 0.2% loss at mid-day, then
recovered to finish 0.1% higher. Both the S&P 500 and Dow Jones Industrial
Average displayed similar intraday action and gained 0.2% and 0.1% respectively.
The small and mid-cap arenas again showed relative weakness. The Russell 2000
was unchanged and the S&P Midcap 400 Index lost 0.2%. Over the past several
years, the Russell and S&P Midcap indices have become leading indicators for the
direction of the broad market, so their lagging action of the past week is not a
good sign for the stock market overall. It is, however, beneficial for our short
position in the iShares Russell 2000
(
IWM |
Quote |
Chart |
News |
PowerRating) and long position in the
UltraShort S&P Midcap 400 (MZZ).
Turnover
was mixed, but remained well below average levels and in line with typical
late-August lethargy. In the NYSE, total volume increased by 4% over the
previous day, but volume was 4% lower in the Nasdaq. Market internals also
showed a mixed bag. Advancing volume was on par with declining volume in the
NYSE, but was positive by a 2 to 1 ratio in the Nasdaq. It remains difficult to
draw any intelligent conclusions regarding the market’s true underlying health
while many professional traders and institutional players are enjoying their
summer vacations. Market action is likely to remain a bit ambiguous until after
the Labor Day holiday has passed.
Perhaps
the primary reason that stocks took a roller coaster ride yesterday was the
divergence between the Semiconductor Index ($SOX) and most other industries.
While sectors such as Retail and Broker-Dealers sported significant losses and
weighed on the broad market, many tech stocks moved higher. When such
incongruousness is present, it usually results in choppy intraday price action
for the stock market, especially when lower volume fails to confirm either
strength or weakness.
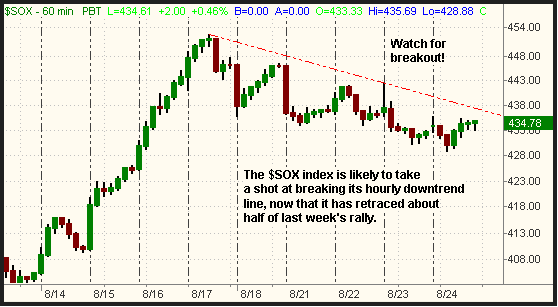
The
beaten-down $SOX index rallied a whopping 10% last week, and corrected 3% lower
in the first three days of this week. Since the retracement in the $SOX has been
rather orderly, one must expect that buyers would soon return to the sector and
attempt to keep the upside momentum going. That is precisely what happened
yesterday afternoon, as traders reversed a morning loss and attempted to push
the $SOX above resistance of its hourly downtrend line. At yesterday’s lowest
level, the $SOX had retraced less than half of the gain from its August 11 low
to its August 17 high. Thus far, the correction has been shallow enough to keep
the short-term uptrend intact. Based on last week’s strength and the
well-mannered retracement, we expect the $SOX will test resistance and attempt
to break out again within the next day or two. We have illustrated resistance of
its short-term downtrend line on the hourly chart of the $SOX below. Moving
averages have been removed so you can more easily see the trendline:

If the
$SOX breaks out above the resistance illustrated above, it’s probably worth a
shot to buy one of the Semiconductor ETFs such as the Semiconductor HOLDR
(
SMH |
Quote |
Chart |
News |
PowerRating)
or the iShares Semiconductor
(
IGW |
Quote |
Chart |
News |
PowerRating). However, we advise keeping a tight
trailing stop and not expecting a huge gain. You might even consider selling
into strength if the $SOX nears its August 17 high, then planning to re-enter
your position if the index consolidates and breaks out to a new high. In this
environment, that is a more prudent way to play the strong sectors as opposed to
holding on in anticipation of a new high, only to watch your profits fade away
when the ETF falls back down.
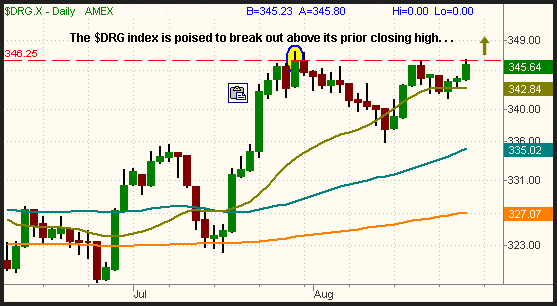
In
addition to the chip stocks, keep an eye on the Pharmaceutical Index ($DRG). The
sector is now poised to break out and resume last month’s uptrend after having
corrected and consolidated for several weeks. Take a look:

If the $DRG
index breaks out, you might consider buying one of the Pharmaceutical ETFs.
However, breakouts have had a high rate of failure lately, so we again advise a
short-term time horizon and a tight trailing stop. IHE, PJP, and PPH are a few
of the ETF ticker symbols that are tied to the Pharmaceutical sector and have
similar charts to the $DRG index. A complete list of all associated ETFs can be
found on the
Morpheus
ETF Roundup guide.
Open
ETF positions:
Long MZZ, short IWM and IYR (regular subscribers to
The Wagner Daily receive detailed stop and target prices on open
positions and detailed setup information on new ETF trade entry prices. Intraday
e-mail alerts are also sent as needed.)
Deron Wagner is the head trader of Morpheus Capital Hedge
Fund and founder of Morpheus Trading Group (morpheustrading.com),
which he launched in 2001. Wagner appears on his best-selling video, Sector
Trading Strategies (Marketplace Books, June 2002), and is co-author of both The
Long-Term Day Trader (Career Press, April 2000) and The After-Hours Trader
(McGraw Hill, August 2000). Past television appearances include CNBC, ABC, and
Yahoo! FinanceVision. He is also a frequent guest speaker at various trading and
financial conferences around the world. For a free trial to the full version of
The Wagner Daily or to learn about Deron’s other services, visit
morpheustrading.com
or send an e-mail to
deron@morpheustrading.com .
