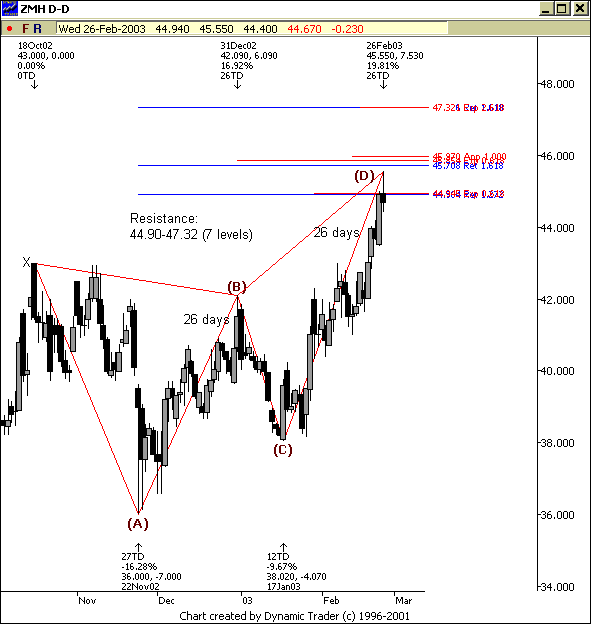
Why I’m Watching This Butterfly
Zimmer Holdings
(
ZMH |
Quote |
Chart |
News |
PowerRating) has completed a Bearish Butterfly
pattern on the daily chart below. This pattern is occurring as price is testing
a large Fibonacci price resistance zone from 44.90-47.32. The other part of this
chart that caught my eye was the time symmetry of the AB=CD move. A to B was 26
days and C to D completing today was 26 days.
Today I took a short in this stock with a stop above the resistance zone around
47.50. When the high is established, I will update this chart with support and
my initial and final objectives on the trade. So, for now I have about 2.5
points of risk in the trade.Â
Now, the alternate scenario is if
(
ZMH |
Quote |
Chart |
News |
PowerRating) pushes up through resistance. That
would be extremely bullish for this stock. In that scenario I get stopped out of
my short and I clear the chart and wait for a pullback into a Fibonacci price
support zone. Then, I would start looking for long trades.
Rule of
thumb: A broken butterfly typically leads to a nice continuation
move.

The Quiz
Results: Thanks to all who participated
in the quiz from
Monday. I was surprised by the number of responses. The answers to the
questions from the last column were:
-
599 million Â
-
700 millionÂ
-
53 days at current usage
Congrats to the winner Brad D.
who responded in record time with the correct answer. Be alert for the Monday
Afternoon Quiz!
Have a great night
