Why It’s Different This Time
The
Fed has indicated that it will tip-toe towards a policy shift that
will probably begin re-normalizing interest rates sometime later this
year. Global investors seem to be over-discounting the degree of rate increases
and how quickly they will be increased, presently, and this is causing some
pretty wild volatility in the markets. As we’ve been emphasizing since late last
year, it’s a high-risk environment again.
Let’s look at the big
picture. The Fed and most other central banks around the world have implemented
a massive monetary and fiscal policy stimulus aimed at preventing the popping of
the historic equity bubble from pushing the world into an unstoppable
deflationary spiral. The effects of this massive stimulus have been extremely
uneven throughout the global economy, but reflation has at least temporarily
been successful in leading to stronger global growth. But the tricky part is
ahead:Â The Fed and global central bankers must soon raise interest rates before
higher inflation becomes entrenched. This is tricky because too much raising
rates too fast could abort the recovery and lead to a financial crisis. The
response to artificially low interest rates has been an unusually large build up
of leverage, particular from consumers, but also from hedge funds and other
financial entities.Â
Investors therefore need to
understand that while in the past, central bankers were pre-emptive in their
raising of rates to stem inflationary pressures, this time is different. Instead
central bankers must tip-toe toward raising rates in a slow, reactive, and
deliberate fashion to prevent aborting the recovery. Greenspan took such a
baby-step this week be emphasizing that the deflationary threat has
substantially receded and that rates will eventually have to be raised to thwart
inflation.  The markets have not reacted well to even this mention of the
potential of rates moving up, which shows how sensitive investors are to the
threat of higher rates.Â
The markets are likely over
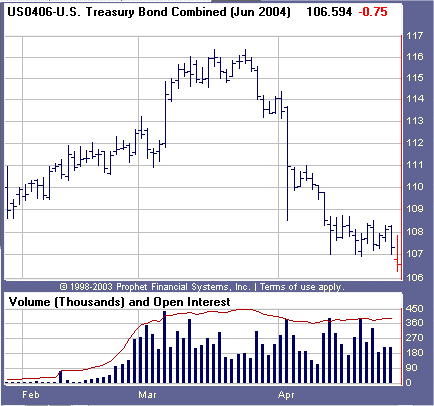
reacting as rate hikes are discounted sooner and sharper than is likely. Bonds
have crashed and taken the interest sensitives down with them.  Bonds are
testing last year’s lows which will likely transition to a trading range for
some time.Â
Asian bonds should be weaker.Â
Investors should avoid all but the shortest duration bonds in general.
Stocks are stuck between
overvaluation and the prospect of eventually rising interest rates on one hand,
and a strong profit growth backdrop on the other. The bias is slightly toward
profit growth overwhelming the negatives after this correction runs its course,
as investors realize that the rate hikes will be slow to develop and done in
tentative baby-steps. It is true that a bear market in stocks normally does not
develop until investors can extrapolate higher rates to the point of leading to
economic deceleration. We are not at this point yet. However, this is not a
clearly bullish equity backdrop. And investors must realize that there are huge
risks — such as terrorist action leading up to elections this summer and fall,
that should lead investors to be cautious about over exposure to this asset
class.
^Next^
Â
Investors also need to
understand, that despite massive stimulus, inflationary pressures are not very
strong. World growth is sustainable but uneven, and the global economy
continues to depend on demand from the US and China as its main engines.Â
Currency markets are fluctuating to try and synchronize growth. Thus as
currencies weaken, national equity indexes rise, and as currencies strengthen,
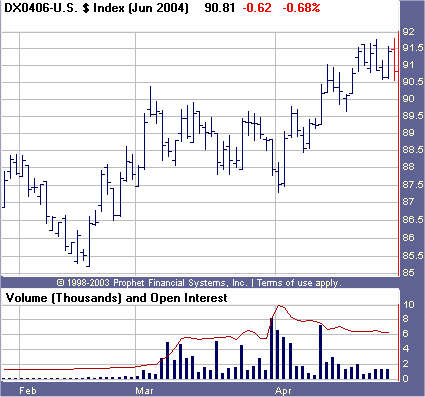
national equity indexes fall. The recent dollar rally has coincided with a
weaker trading range environment for US stocks, for instance. Secular
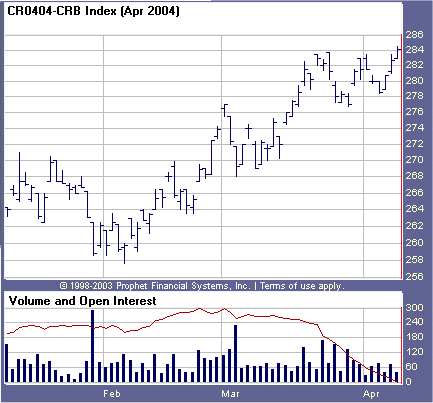
overproduction is barely being absorbed even with massive stimulus. Present
inflationary pressures are more related to commodity and currency movements than
to clearly excessive demand. Normally until the dollar falls below PPP, even
commodity induced inflationary pressure remains slower to develop than the
typical demand-push induced inflation which is not yet evident anywhere. The
path toward inflation is up, but it is likely to be slower and more modest than
recent market reactions are anticipating.Â
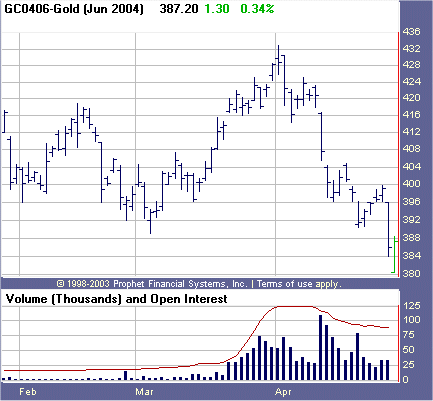
As rates re-normalize, gold is
likely to range-trade and be volatile. Gold prices have mirrored reflationary
pressures since the mid 90’s. With the bulk of rate hikes likely to take place
next year, gold can still move higher before signaling reflationary reverse —
but the trend is likely to be more like volatile trading range with an upward
bias than the straight up move we’ve seen since 2001.Â
The action in the dollar is
likely to mirror gold. The dollar is approaching trendline resistence here and
could inch higher over the coming months before reasserting the longer-term
decline. But much of the force of that decline is likely behind us.
So far our US long/short model has been relatively inactive during 2004–only
one official long,
(
CLB |
Quote |
Chart |
News |
PowerRating))–and we continue to suggest investors use some
caution until stocks meeting our criteria expand in breakout breadth. Â Investors
should continue to cautiously add stock exposure as trade signals are generated
that meet our strict criteria, as well as allocate to our favorite segments on
breakouts and signals as advised above. Our model portfolio followed in
TradingMarkets.com with specific entry/exit/ops levels from 1999 through May of
2003 was up 41% in 1999, 82% in 2000, 16.5% in 2001, 7.58% in 2002, and we
stopped specific recommendations up around 5% in May 2003 (strict following of
our US only methodologies should have had portfolios up 17% for the year 2003) —
all on worst drawdown of under 7%.  This did not include our foreign stock
recommendations that had spectacular performance in 2003.Â
This week in our Top RS/EPS New Highs list published on TradingMarkets.com, we
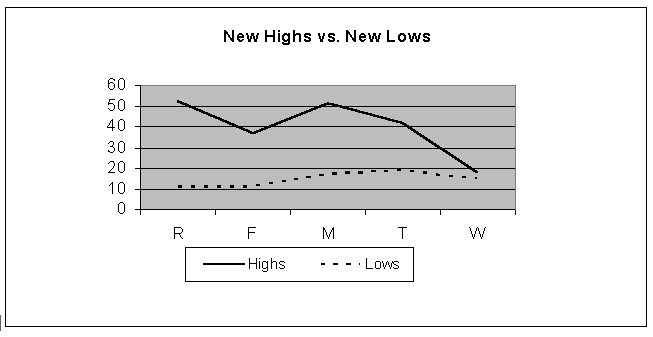
had readings of 52, 37, 51, 42, and 18 with 11 breakouts of 4+ week ranges, no
valid trades and no close calls. Â Upside breadth deteriorated to neutral with a
positive bias AGAIN this past week. Position in valid 4+ week trading range
breakouts on stocks meeting our criteria or in close calls that are in clearly
leading industries, in a diversified fashion. This week, our bottom RS/EPS New
Lows rose from the depths, registering readings of 11, 11, 17, 19, and 15 — not
yet at levels consistent with good shorting opportunities, but improving
markedly.Â
For those not familiar with our long/short strategies, we suggest you review my
book
The Hedge Fund Edge, my course “The
Science of Trading,”
my video seminar, where I discuss many
new techniques, and my latest educational product, the
interactive training module. Basically,
we have rigorous criteria for potential long stocks that we call “up-fuel,” as
well as rigorous criteria for potential short stocks that we call “down-fuel.”
Each day we review the list of new highs on our “Top RS and EPS New High List”
published on TradingMarkets.com for breakouts of four-week or longer flags, or
of valid cup-and-handles of more than four weeks. Buy trades are taken only on
valid breakouts of stocks that also meet our up-fuel criteria. Shorts are
similarly taken only in stocks meeting our down-fuel criteria that have valid
breakdowns of four-plus-week flags or cup and handles on the downside. In the
U.S. market, continue to only buy or short stocks in leading or lagging
industries according to our group and sub-group new high and low lists. We
continue to buy new long signals and sell short new short signals until our
portfolio is 100% long and 100% short (less aggressive investors stop at 50%
long and 50% short). In early March of 2000, we took half-profits on nearly all
positions and lightened up considerably as a sea of change in the
new-economy/old-economy theme appeared to be upon us. We’ve been effectively
defensive ever since, and did not get to a fully allocated long exposure even
during the 2003 rally.Â
We continue to advise keeping allocations low until the trend is more certain.
Mark Boucher
