Why the bull market in commodities isn’t over
It is a well-known intermarket
principal that the dollar should move opposite of commodities,
especially hard commodities such as gold and oil.
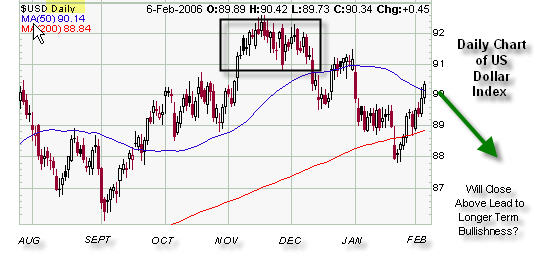
If you review a daily chart of the US Dollar Index ($USD), it
appears as if the dollar has been in a bull market since this past September as
it was able to cross above its’ 50-day simple moving average. Currently, the
dollar, after having tested its’ support at the 200-day simple moving average,
is trying to regain strength and push through its’ 50-day simple moving average
again.
The Reuters-Jeffries CRB Index is firmly in a bull market on its’ daily chart
after having successfully tested its’ 50-day simple moving average in November.
The question is, how could we be having a bull market in the dollar at the same
time that we are having a bull market in commodities? And, does this strength in
the dollar mean that the bull market in commodities is on its’ last legs?
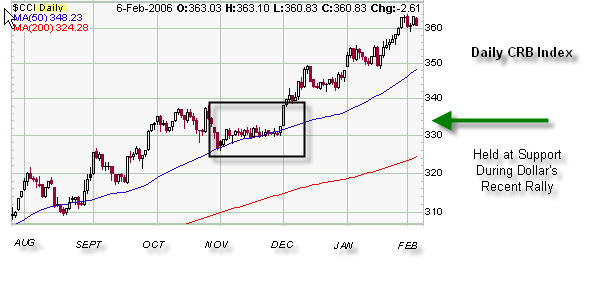
You can see by comparing these two charts that the daily bull
market reached its’ peaks in November just as the CRB Index was testing its
50-day SMA. It is significant here that the CRB did not break through this
average even though the dollar was able to rally to the upside. Let’s look at a
longer time horizon to see if we can get a better handle on things.
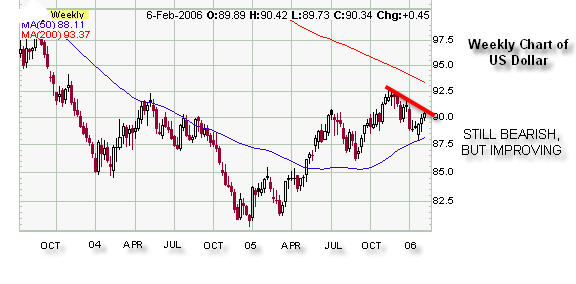
On this weekly chart, the dollar is above its 50-week simple
moving average, but has yet to reach above its 200-week simple moving average.
Also, the 200-week moving average is above the 50-week moving average, not
technically a bull market.
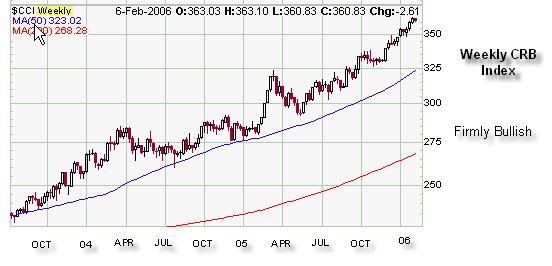
The weekly chart below of the Reuters-Jeffries CRB Index ($CCI) is firmly in a
bull market. Based on this information, the inverse relationship between the
dollar and commodities remains intact. Watch for a close of the $USD above its
200-week simple moving average and a cross of the weekly moving averages to
their bullish positions (200-week under 50-week). In conjunction with that move,
we would also need to see a breakdown in the CRB Index (on the weekly chart) in
order to conclude that the bull market in commodities was over.
Sara Conway is a
registered representative at a well-known national firm. Her duties
involve managing money for affluent individuals on a discretionary basis.
Currently, she manages about $150 million using various tools of technical
analysis. Mrs. Conway is pursuing her Chartered Market Technician (CMT)
designation and is in the final leg of that pursuit. She uses the Point and
Figure Method as the basis for most of her investment and trading decisions, and
invests based on mostly intermediate and long-term trends. Mrs. Conway
graduated magna cum laude from East Carolina University with a BSBA in finance.