Why the EUR/USD is Ready to Move Lower
These are not exactly good times for GBP/USD and EUR/USD bulls. The EU is currently down about 20 cents from its yearly open while the GU is down about 40 cents after 11 months of trading. The former pair has only managed about 12 days above the 20EMA since the start of this hellacious summer sell-off and the latter pair only posting about 10 days above.
Neither of these are inspiring or impressive statistics and we thought we’d look towards the clouds to see how they should fair for the rest of the year.
Scanning the daily EU chart below, we see the continued downward trajectory of the 20EMA which has only had a few cameo’s flattening out only to start another decline. It looks set to begin another but with volume thinning over the next few weeks, unless we get a major break below the lows for this year (posting in around the 1.23 handle) then we expect the pair to remain range bound between 1.23 and 1.3050ish. The clouds is what affords us a greater purview as you can see them declining and hovering above the 1.30 level from December 6th on and falling ever so gently after.
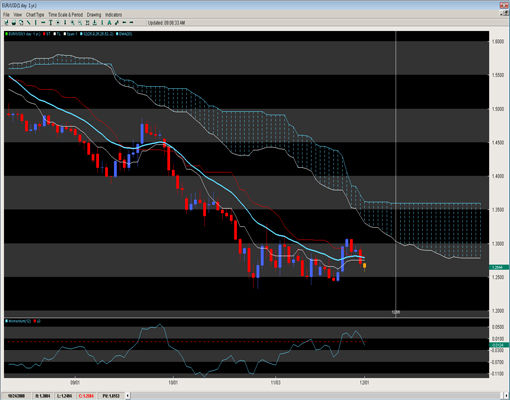
This should curtail most upward efforts and now that the thin window in the clouds has passed, we anticipate the pair should remain below the critical 1.30 level for the remainder of the year (barring any significant global market shift). The only positive technical model is the momentum model which is showing massive divergence. However it gave a similar reading in late September and we all know how that worked out for the EU. Plus the momentum is also very jagged which suggests less consistency in the order flow or more of a fight going on between the 1.30 and 1.23 handles.
The GU is acting like no spring chicken right now and has fared much worse than its EU counterpart. Having both less days above the 20EMA on the daily charts and also selling off much worse, the end of the year outlook is not impressive or hopeful for the GU bulls.
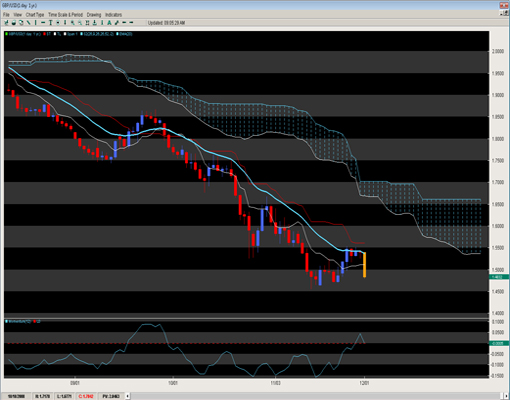
The chart below intimates the 1.55 as being the near term ceiling for the pair with the 20EMA and Kijun (red line) acting as defenses for any upward skirmishes. The cloud also is being nicely predictive as the falling Kumo (blue cloud) does not offer a positive outlook. After the 12th of December, the chances for the pair ending the year above 1.55 diminish significantly and if it is not above that level by then,we expect the pair to remain below the 1.55 big figure for the rest of the year. The range that should play out of the rest of the year is between the 1.55-1.45 levels offering up good R:R opportunities. Any daily closes above the Kijun (red line) or large candle closes below the 1.45 region should trigger stops and likely create quick and powerful moves as technical models will likely enter on such breaks.
Chris Capre is the Founder of Second Skies LLC which specializes in Trading Systems, Private Mentoring and Advisory services. He has worked for one of the largest retail brokers in the FX market (FXCM) and is now the Fund Manager for White Knight Investments (www.whiteknightfxi.com/index.html). For more information about his services or his company, visit www.2ndskies.com.