Why Volatility Bands Are A Powerful Reversal Strategy
What Wednesday’s
Action Tells You
Eighty-five to ninety percent of the time after an overexuberant, emotional opening, there is a contra move in the major indices and 60% of the time price will resume the direction of the open. Yesterday the indices did just that, but with an added
kicker: the move in the direction of the open failed after a 5.5 point up-move
to1049.50 in the S&P E-mini, then it made another trip down to a new intraday
low of 1041.50, closing at 1044.75. So much for the hype, but just another bonus
for daytraders who are familiar with my first hour reversal strategies
NYSE volume expanded to 1.46 billion yesterday,
with a volume ratio of 36, and breadth weaker at -705. Yesterday was the third
day in succession of higher highs and higher lows in conjunction with a
declining volume ratio which has gone 75, 54 to 36. The SPX closed at 1046.76,
below the previous close and -0.3% on the day. The Dow finished at 9803, -0.1%
after hitting an intraday high of 9850. The Nasdaq, at 1939, was -0.2%, the QQQs,
35.19, -0.4%, while the SMH had a wild opening ride of +3.5%, but declined over
the day to finish at 39.14, +0.7%. INTC closed at 31.76, +2.2%, after being up
almost 6%. The major sectors all finished red, led by the OIH, -2.4% aznd
the BBH -1.9%.
I have included the 5-minute charts in today’s
commentary of INTC, SMH, and the S&P E-mini, which highlight the strategies
from yesterday. The initial trades in INTC and/or the SMH were clearly defined
volatility band trades that reversed on the first bar because of the hyped
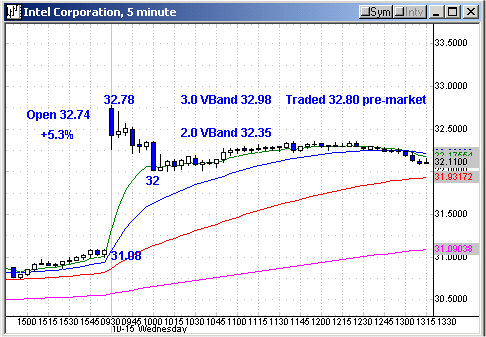
opening across the board. Looking at the INTC chart, you see that it opened at
32.74 on the 9:30 AM bar, +5.3%, and made the 32.78 intraday high also on that
first bar. In the pre-market, it did hit 32.80 and was +5.8% when I stopped
looking at it.
For Active Traders
Yesterday’s 3.0 volatility band was 32.98, so you
could fade it right on that first bar certainly for part of your position. You
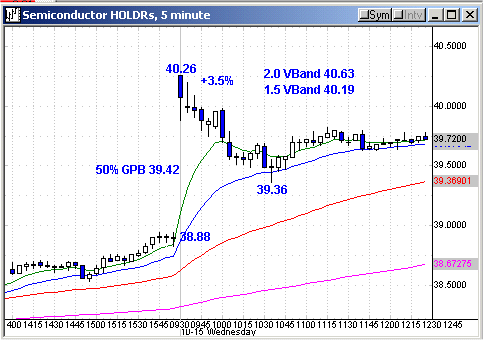
will see why when we move to the E-mini chart. The SMH gapped open to 40.26,
which was +3.5% and also the intraday high and just between the 2.0 volatility
band of 40.63 and the 1.5 volatility band of 40.19.
If you trade the semi and SMH HOLDRs, you know that we have been in this
situation many times before and I would be hard pressed to find more than one
time that there wasn’t a decent contra move from the 2.0 to 3.0 volatility band
zones. This time was no exception, as INTC declined to 32 by the 10 AM bar and
the SMH to 39.36 on the 10:35AM bar. Both of them went up small and then
sideways from there before making new intraday lows on that swing down after 2
PM.
INTC hit 31.62 and the SMHs 38.94, which is
-3.3% from the 40.26 high before closing at 39.14. Let’s now look at the E-mini
chart, which gives you confirmation why you would take the volatility band trade
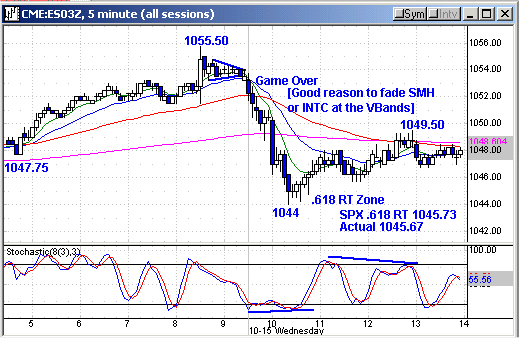
in the SMHs or any other big-cap correlated charts for that matter. After the
pre-market markup in the futures to 1055.50 from a 1047.75 close the previous
day, the E-mini formed a narrow range dynamite triangle and the wide range bar
breakout down was on the 9:30 AM bar, certainly a signal that a contra-move was
on for the major indices, which it was, as the E-mini traded down to 1044.This
pattern on the E-mini gave you the confidence to take the volatility band trade
in the SMH or INTC.
I said 60% of the time price will resume the direction of the open after the
contra move, which in this case was down to 1044, which happened to be the
240-EMA and also the .618 retracement zone to Tuesday’s low of 1039. For the
SPX, the .618 retracement to its Tuesday low was 1045.73 and the actual low on
this retracement was 1045.67. The SPX chart is not shown.
Because of this, there was good reason to take a
long entry here, or at least covering any shorts you made up top out of the
triangle that played that way instead of the SMH or INTC.
As you see on the E-mini chart, there was also a
positive divergence on the 8,3,3, slow stochastics. This wasn’t a great move up
by any shakes, and failed at 1049.50, accompanied by a negative divergence which
won out, as the E-mini traded down to a 1041.75 intraday low, just above
Tuesday’s 1039 intraday low.
Needless to say, the volatility was excellent for
daytraders, but giving the major indices their due, there’s still no trading or
close below the low of the high day, which of course was a new high yesterday.
The trend up from Sept 30 remains intact along with the larger trend.
For Today
For today and Friday’s expiration, traders are on
the fence, ready to react to the volatility like they did yesterday.
Certainly the positive price and volume in the S&P 500 stocks yesterday was in
the SEMIs, led by INTC, which traded 285 million vs. a 62 million 30-day
average, closing at 31.77, +2.2%. The other big semi focus was AMAT, +3.3%,
closing at 21.60 on 88 million vs. a 32 million 30-day average, and Novellus,
38.74, +3.5%, on 20 million vs its 8 million average.
Any early down today in the semis, daytraders should look for a long side intraday setup as the Generals paid higher prices yesterday and will probably protect on the downside by buying some more, but won’t chase price. While the major indices have advanced since Sept. 30, some of
the momentum stocks have been pulling back the last 3-8 days following their
negative divergence in momentum on the daily chart. For example, APOL was -4.4%
on 6.6 million shares vs 1.8 million share 30-day average daily volume, having
traded down to a 62.50 close yesterday and 8 days from a 69.38 double top. It
closed below its 8, 20, 50, and 89-day EMAs. The 89-day EMA is 63.25, with the
200-day EMA down at 57.42. When that kind of price action happens it gets
me interested. Another one is AVID, which closed at 52.06 yesterday, down from
59.77 just 2 days ago.It closed below its 8 and 20-day EMAs but just above its
50-day EMA of 51.73, so you have another inflection point to play with both
ways. This is another stock that was making new highs with negative and
momentum. You look at other momentum stocks such as PCAR and SNPS and you also
see some money being taken off the table as they ring the register. As these
kinds of stocks retrace, they again go on the daily watchlist because there will
be good opportunity both ways around inflection points as they pull back.
This is an interesting few days coming up, with
Friday being the 13th day of the current reflex up from the Sept 30 retracement
low, and also being option expiration. You might also throw in the full moon.
The Monday following expiration hasn’t been very positive, not to mention that
this Monday is October 19, which is the anniversary of the 1987 crash, which was
down 22.6% in one day. My point is not to scare you with trivia, but to make you
react to any volatility that stretches price rather than initiating because you
think something should be, etc. etc. etc.
Have a good trading day
Kevin Haggerty


