Why You Should Keep It Simple
Major markets continue to play
ping-pong on the thirteen-minute charts as we near the end of this thinly traded
Holiday-shortened week. Volume and
liquidity remain on the low side which is proving a rather choppy pace, yet
markets are attempting to form bearish inverse cups on the 13-minute charts as
we approach midday in the context of potentially emerging hourly downtrends.
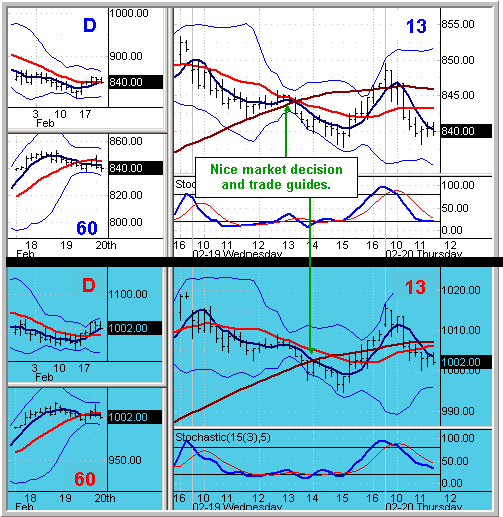
Yesterday’s mention of keeping the trade light until the morning 13 and
60-minute conflicts were resolved (see charts) played out nicely as ES lost a
relatively quick 6 points after its conflict was resolved. As is often the case
during such conflicts, the opposing 13 & 60 minute trend supports essentially
formed a symmetrical triangle with the ultimate trend support break the ticket
to a low-risk entry, with a tight stop on a reversal. Also notice the ES trade
pace prior to the hourly break as even though ES was in a 13-minute downtrend,
the market respected the hourly trend which broke only after several
tests. Using the multiple timeframes in such a manner can greatly aid in trade
management decisions.
Which brings up an interesting point. Have you noticed since we began this trek
a few years back, the number of times where these ridiculously simple indicators
help outline common trading patterns such as triangles, cups, and other familiar
patterns? It certainly has nothing to do with me or the methods — the thousands
of methods in the trading world all do the same thing in terms of attempting to
skew probability in the trader’s favor — yet for those who continue to struggle
and look to more complex methods, returning to simplicity can often help. Such
was the premise on which this silly column was founded two years ago.
ES (S&P)Â Â Â Â Â
Thursday February 20, 2003 11:30 AM ET       NQ
(Nasdaq)

Moving Avg Legend:
5MA
15MA 60-Min 15MA
See
School and
Video for Setups and Methodologies
Charts ©
2002 Quote LLC
Good Trading!
Â
