Why You Should Look For Patterns Within Patterns
The
market has sold off the last two days on below-average volume. Yesterday
could be considered a distribution day for the Nasdaq, but it was borderline. At
this point, I am giving the long side the benefit of the doubt. With tomorrow
likely to be slow pre-holiday trading, any further confirmation of the new rally
probably won’t come until next week.
Pacific Internet
(
PCNTF |
Quote |
Chart |
News |
PowerRating) had an
interesting breakout today of both small- and big-picture cup & handles. Let’s
look at a few charts to see what I’m talking about. (Charts were created around
3pm Eastern and therefore don’t show closing data.)
You can see on the chart below that PCNTF formed a 9-month Cup & Handle
formation. The pivot was around $12.44. Depending on the stop methodology used,
two potential areas to set stops are shown below. The first is an 8% stop, used
by William O’Neil. The second option is the low of the handle, around $9.42.Â
Â

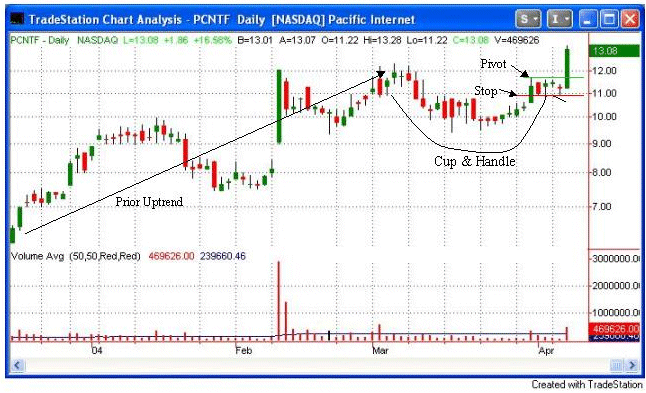
 A look at the daily chart
shows that the handle part of the formation actually formed a Cup & Handle on
its own. Those looking at the daily chart would have seen a pivot above the
$11.71 high and a stop level below the low of the handle at $10.89.
Â

When patterns develop within
patterns, many times you can take the breakout of the smaller timeframe in
anticipation of a big-picture breakout. By taking the breakout on the daily
chart, you would have been able to use a tighter stop, thereby reducing the
amount you risked on the trade. You would also be in a position to benefit from
the bigger-picture breakout. (At a lower cost.)
Lower potential risk and higher potential reward are always a good tradeoff.
Keep your eye out for patterns within patterns similar to the one we looked at
today. They can provide nice potential to bolster your returns.
Happy Easter, or for those of you who don’t celebrate it, enjoy the long
weekend.
Rob Hanna
Â
Â
