Will June Be Constructive Or Destructive For Homebuilders?
Oh
what the heck…somebody has to look for a top in some of these
sectors. Let me rephrase it. The parameters I follow for at least a short- to
intermediate-term correction are lining up in the Homebuilding sector. Let me
summarize:
-
As a sector, it is hitting
multiple extension levels on the upside. These are the 1.272 and 1.618
ratios. When many of these come together from multiple swing points creating
a resistance zone, there is often times a reversal opportunity right behind.AND…
-
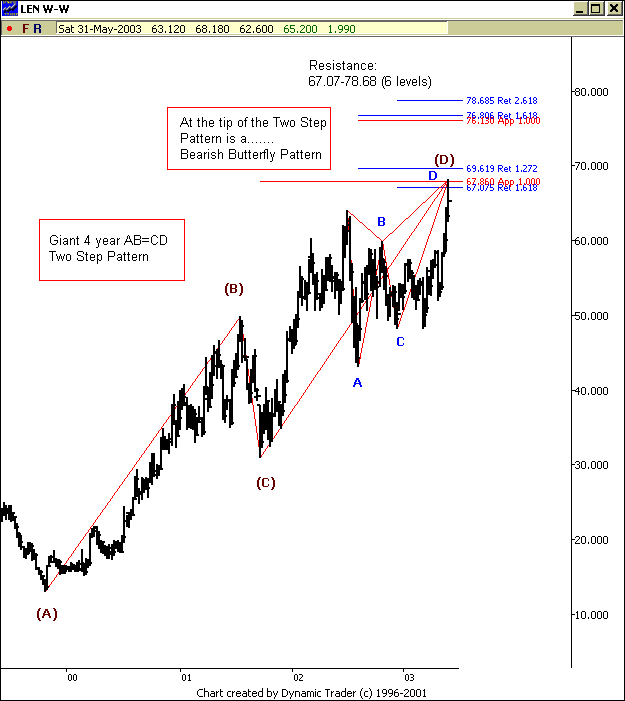
Giant weekly and monthly
bearish patterns like AB=CD two step patterns and Bearish Butterfly
patterns.
Let’s look at a couple of
WEEKLY charts below. First, Lennar
(
LEN |
Quote |
Chart |
News |
PowerRating).
As you can see from the chart below there is a wide Fibonacci resistance zone
from a 67 to 78. We are currently completing two different bearish patterns into
this resistance zone. Personally, I’d be locking in profits in this area on
long trades. And for the contrarian out there, look for short reversal plays
either with the an option scenario or the underlying.

Finally, look at the KB
Home
(
KBH |
Quote |
Chart |
News |
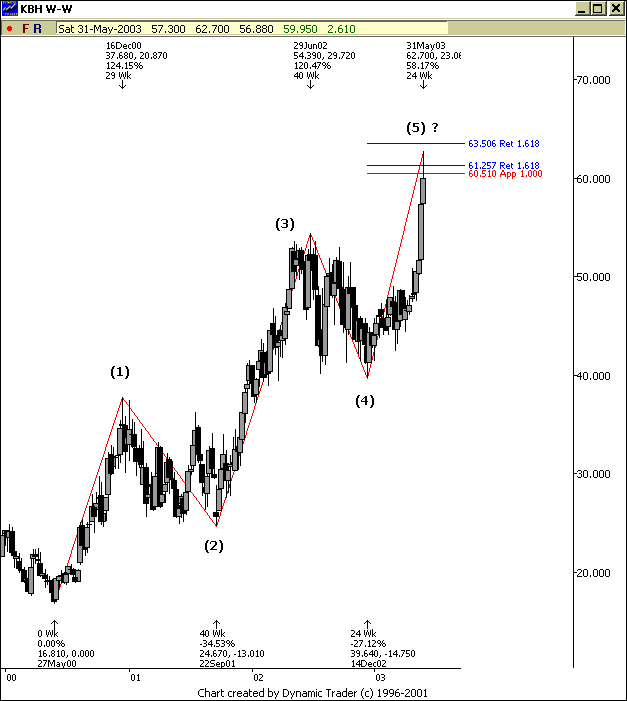
PowerRating) weekly chart below. It appears to have completed a
large 4 year (almost) 5 wave cycle up into Fibonacci extension levels. Is this a
short-term top? I would not be surprised if it was.
 
To summarize, the Homebuilders
have been on fire. The group for the most part are hitting 52-week and all-time
highs. However, I would not be overstaying my welcome in this group, as an
active trader. Corrective moves of 20%-40% are common in these uptrends and
after an extended move to the upside like we’ve just had, mixed with my
Fibonacci parameters, I’d be trailing tight stops and even considering
reversal plays here.
Take care and have a great
weekend!
