Will the Bull Trend End & 3 Power Ratings Stocks
The massive 2009 stock market bull run shows little sign of abatement into the early days of 2010. The VIX fear index which measures projected future volatility gapped down to below 17, clearly signaling the return of investor optimism.
While the S&P 500 has increased over 69% since March 2009. This move was far steeper than the inherent upward drift of the market. How long will this momentum with limited pullbacks last? One way to answer this question is to look to the past for guidance.
According to Dr. Brian Taylor of Global Financial Data, Inc, the average bull run lasts 3 years, 7 months resulting in an increase of 189%. The longest bull run lasted over 10 years and the shortest was only 3 months. The surge in the 1920s was the strongest with the market increasing by a whopping 657%. Provided these historic facts, this bull trend may just be starting!! However, no one really knows for sure what the future holds. All we can do, as short term investors, is to use methods and tactics proven to locate stocks primed for gains regardless of underlying conditions. This is far easier said then done despite the roaring bull conditions.
Fortunately, we have developed an easy to use 3 step system that works effectively with little regard to the underlying market. This article will lay out the steps and provide 3 stocks primed for short term gains.
The first and most critical step is to only look at stocks trading above their 200-day Simple Moving Average. This assures that a strong, long term up trend is in place, increasing the odds that you are not buying into a falling knife or catching a stock in a death spiral.
The second step is to drill deeper into the list locating stocks that have fallen 5 or more days in a row or experienced 5 plus consecutive lower lows. Yes, you heard me right, fallen 5 or more days in a row. I know this is counter-intuitive of conventional wisdom of buying stocks as they climb higher. However, our studies have clearly proven that stocks are more likely to increase in value after a period of down days than after a period of up days.
The third and final step is a combination of whittling the list down even further by looking for names whose 2-period RSI (RSI)2 is less than 3 (for additional information on this proven indicator click here) and the Stock PowerRating is 8 or higher.
The Stock PowerRatings are a statistically based tool that is built upon 14 years of studies into the inner nature of stock prices. It ranks stocks on a scale of 1 to 10 with one being the most volatile and least likely for short term gains and 10 proven to be the most probable for gains over the next 5 days. In fact, 10 rated stocks have shown to have a 14.7 to 1 margin of outperforming the average stock in the short term.
The stocks that fulfill each of the above steps have proven in extensive, statistically valid studies to possess solid odds of increasing in value over the 1 day, 2 day and 1 week time frame.
^TRGT^
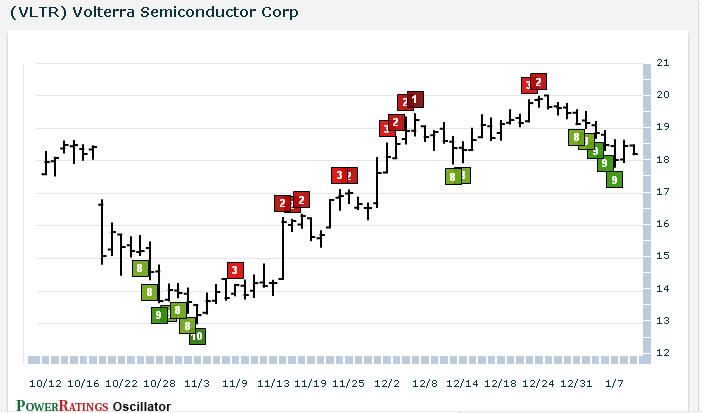
^VLTR^

^GIII^
Learn more strategies for trading stocks in the short term with a free trial to our PowerRatings! The highest rated stocks have outperformed the average stock by a margin of more than 14.7 to 1 after five days! Click here to launch your free PowerRatings trial today!
David Goodboy is Vice President of Business Development for a New York City based multi-strategy fund.
